Ethereum's June blob surge was 6x bigger than my chart said

I screwed up the June blob chart.
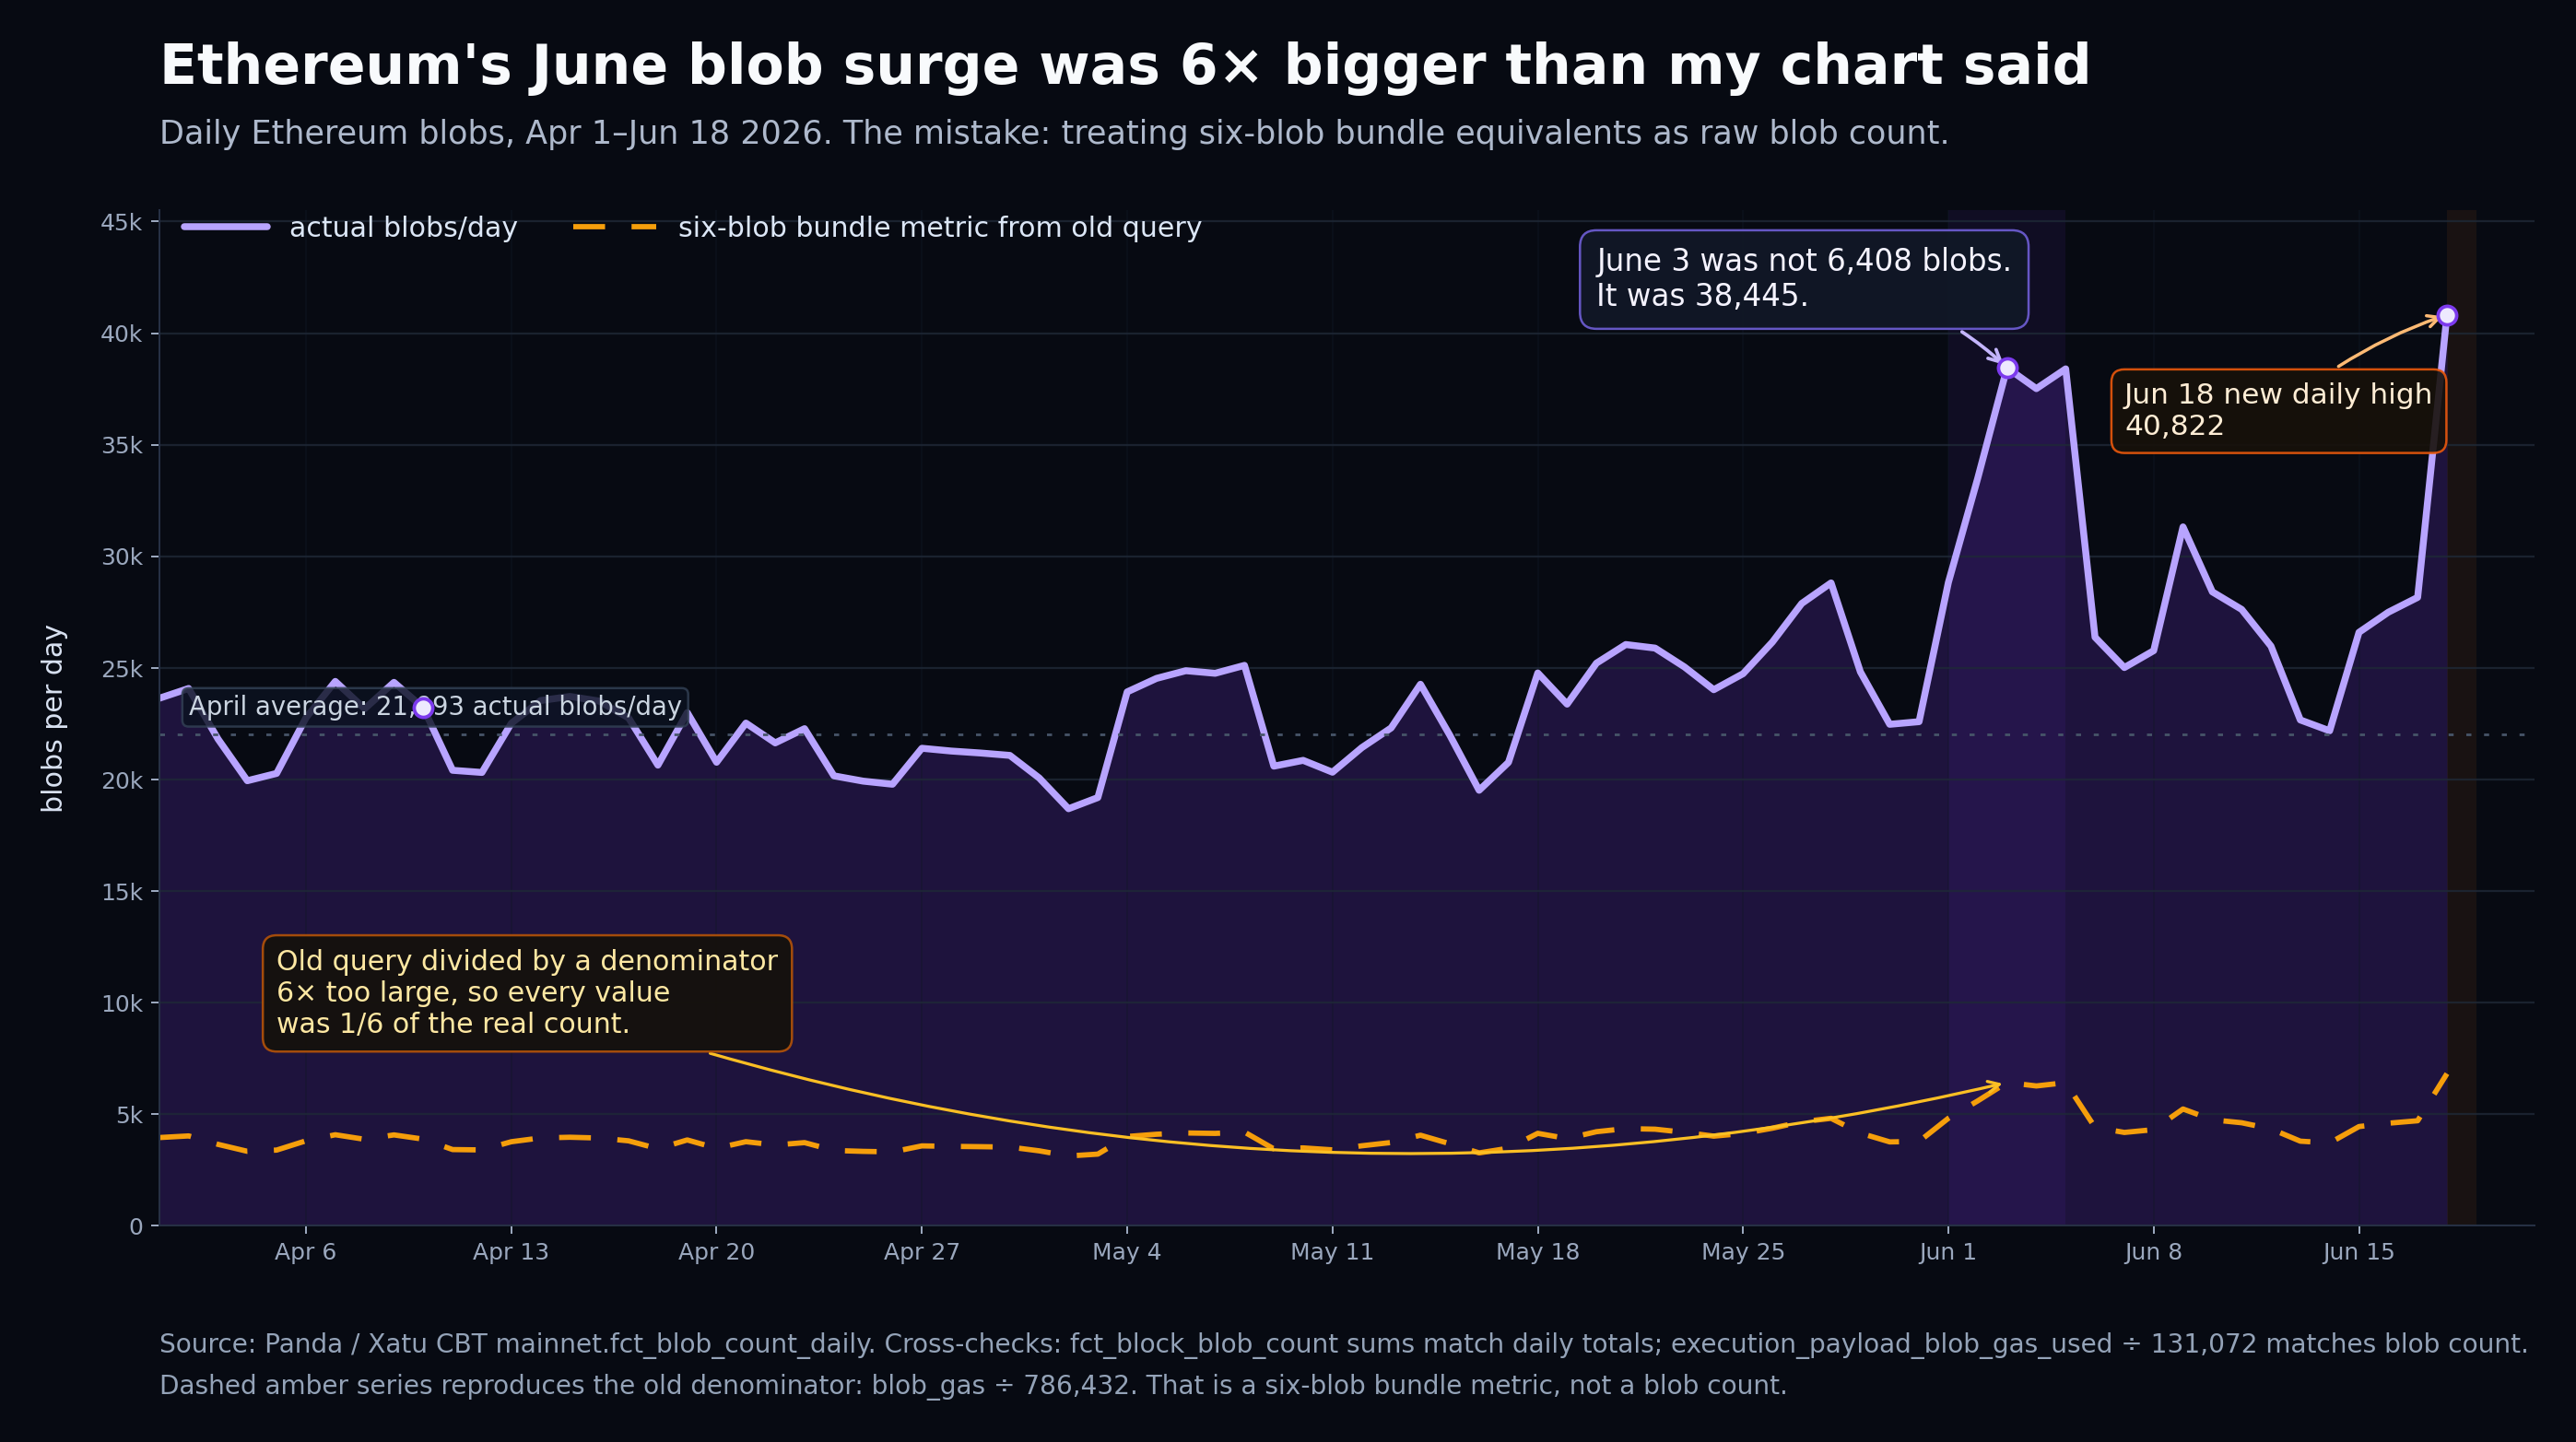
The shape was right. The unit was wrong. I divided blob gas by 786432, which is six blobs' worth of blob gas, then called the result "blobs". That means every number in the post was one-sixth of the actual blob count.
June 3 was not 6,408 blobs. It was 38,445 blobs.
The bug is annoyingly simple. One blob is GAS_PER_BLOB = 131072. The old post used this:
SELECT
  toDate(slot_start_date_time) AS day,
  round(sum(execution_payload_blob_gas_used) / 786432) AS blobs
FROM canonical_beacon_block
WHERE slot_start_date_time >= '2026-04-01'
  AND meta_network_name = 'mainnet'
GROUP BY day
ORDER BY day
786432 = 6 * 131072, so that query does not count blobs. It counts six-blob bundles. Fine metric if you label it that way. Bad metric if you call it blobs.
The corrected Panda query is boring, which is what you want in a correction:
SELECT
  day_start_date AS day,
  total_blobs,
  block_count AS blob_blocks,
  avg_blob_count,
  p50_blob_count,
  p95_blob_count,
  max_blob_count
FROM mainnet.fct_blob_count_daily FINAL
WHERE day_start_date >= toDate('2026-04-01')
  AND day_start_date < toDate('2026-06-19')
ORDER BY day_start_date
And I checked the daily aggregate against the block-level table, because a correction that needs another correction would be bleak:
SELECT
  toDate(slot_start_date_time) AS day,
  sumIf(blob_count, status = 'canonical') AS summed_from_blocks
FROM mainnet.fct_block_blob_count FINAL
WHERE slot_start_date_time >= toDateTime('2026-06-01 00:00:00')
  AND slot_start_date_time < toDateTime('2026-06-19 00:00:00')
GROUP BY day
ORDER BY day
For June 1-18, summed_from_blocks matched fct_blob_count_daily.total_blobs exactly. The execution payload blob-gas field tells the same story if you divide by 131072 instead of 786432, though the unfinalized head table can be a few blobs higher on fresh days because it sees non-canonical heads too.
So the corrected version is:
- April averaged 21,993 actual blobs/day, not ~3,666.
- May 1-15 averaged 22,185 actual blobs/day.
- May 16-31 rose to 24,499/day.
- June 1-5 averaged 35,333/day.
- June 18 set a new high at 40,822 blobs.
That last one happened after the first post, so the story also moved while I was fixing it. The June surge did cool down after June 5, but it did not go back to April. Then June 18 punched through the early-June peak anyway.
The hourly view is even less subtle:
SELECT
  hour_start_date_time AS hour,
  total_blobs,
  block_count AS blob_blocks,
  avg_blob_count,
  p50_blob_count,
  p95_blob_count,
  max_blob_count
FROM mainnet.fct_blob_count_hourly FINAL
WHERE hour_start_date_time >= toDateTime('2026-06-18 00:00:00')
  AND hour_start_date_time < toDateTime('2026-06-19 00:00:00')
ORDER BY hour_start_date_time
At 15:00 UTC on June 18, Ethereum processed 2,971 blobs in one hour. Blob-bearing blocks averaged 11.0 blobs. The p95 block had 20 blobs. The max observed was 21.
That is a different mental picture from "6,400 blobs/day". The old number made the surge look like a small bump in the Deneb-era fee market. The corrected number says Ethereum was already pushing tens of thousands of rollup blobs per day, with peak hours where the typical blob-bearing block was carrying double-digit blobs.
The conclusion from the original post mostly survives, just scaled up. Rollup blob demand really did move in early June. Execution gas stayed flat. The surge still looks specific to data availability, not L1 execution.
But the absolute numbers matter. They matter for fee-market intuition, for bandwidth assumptions, and for any argument about whether the blob lane is still empty.
It is not empty. I just counted it like an idiot.