Ethereum's June 18 blob record carried less data than June 3
June 18 looked like a new blob demand record.
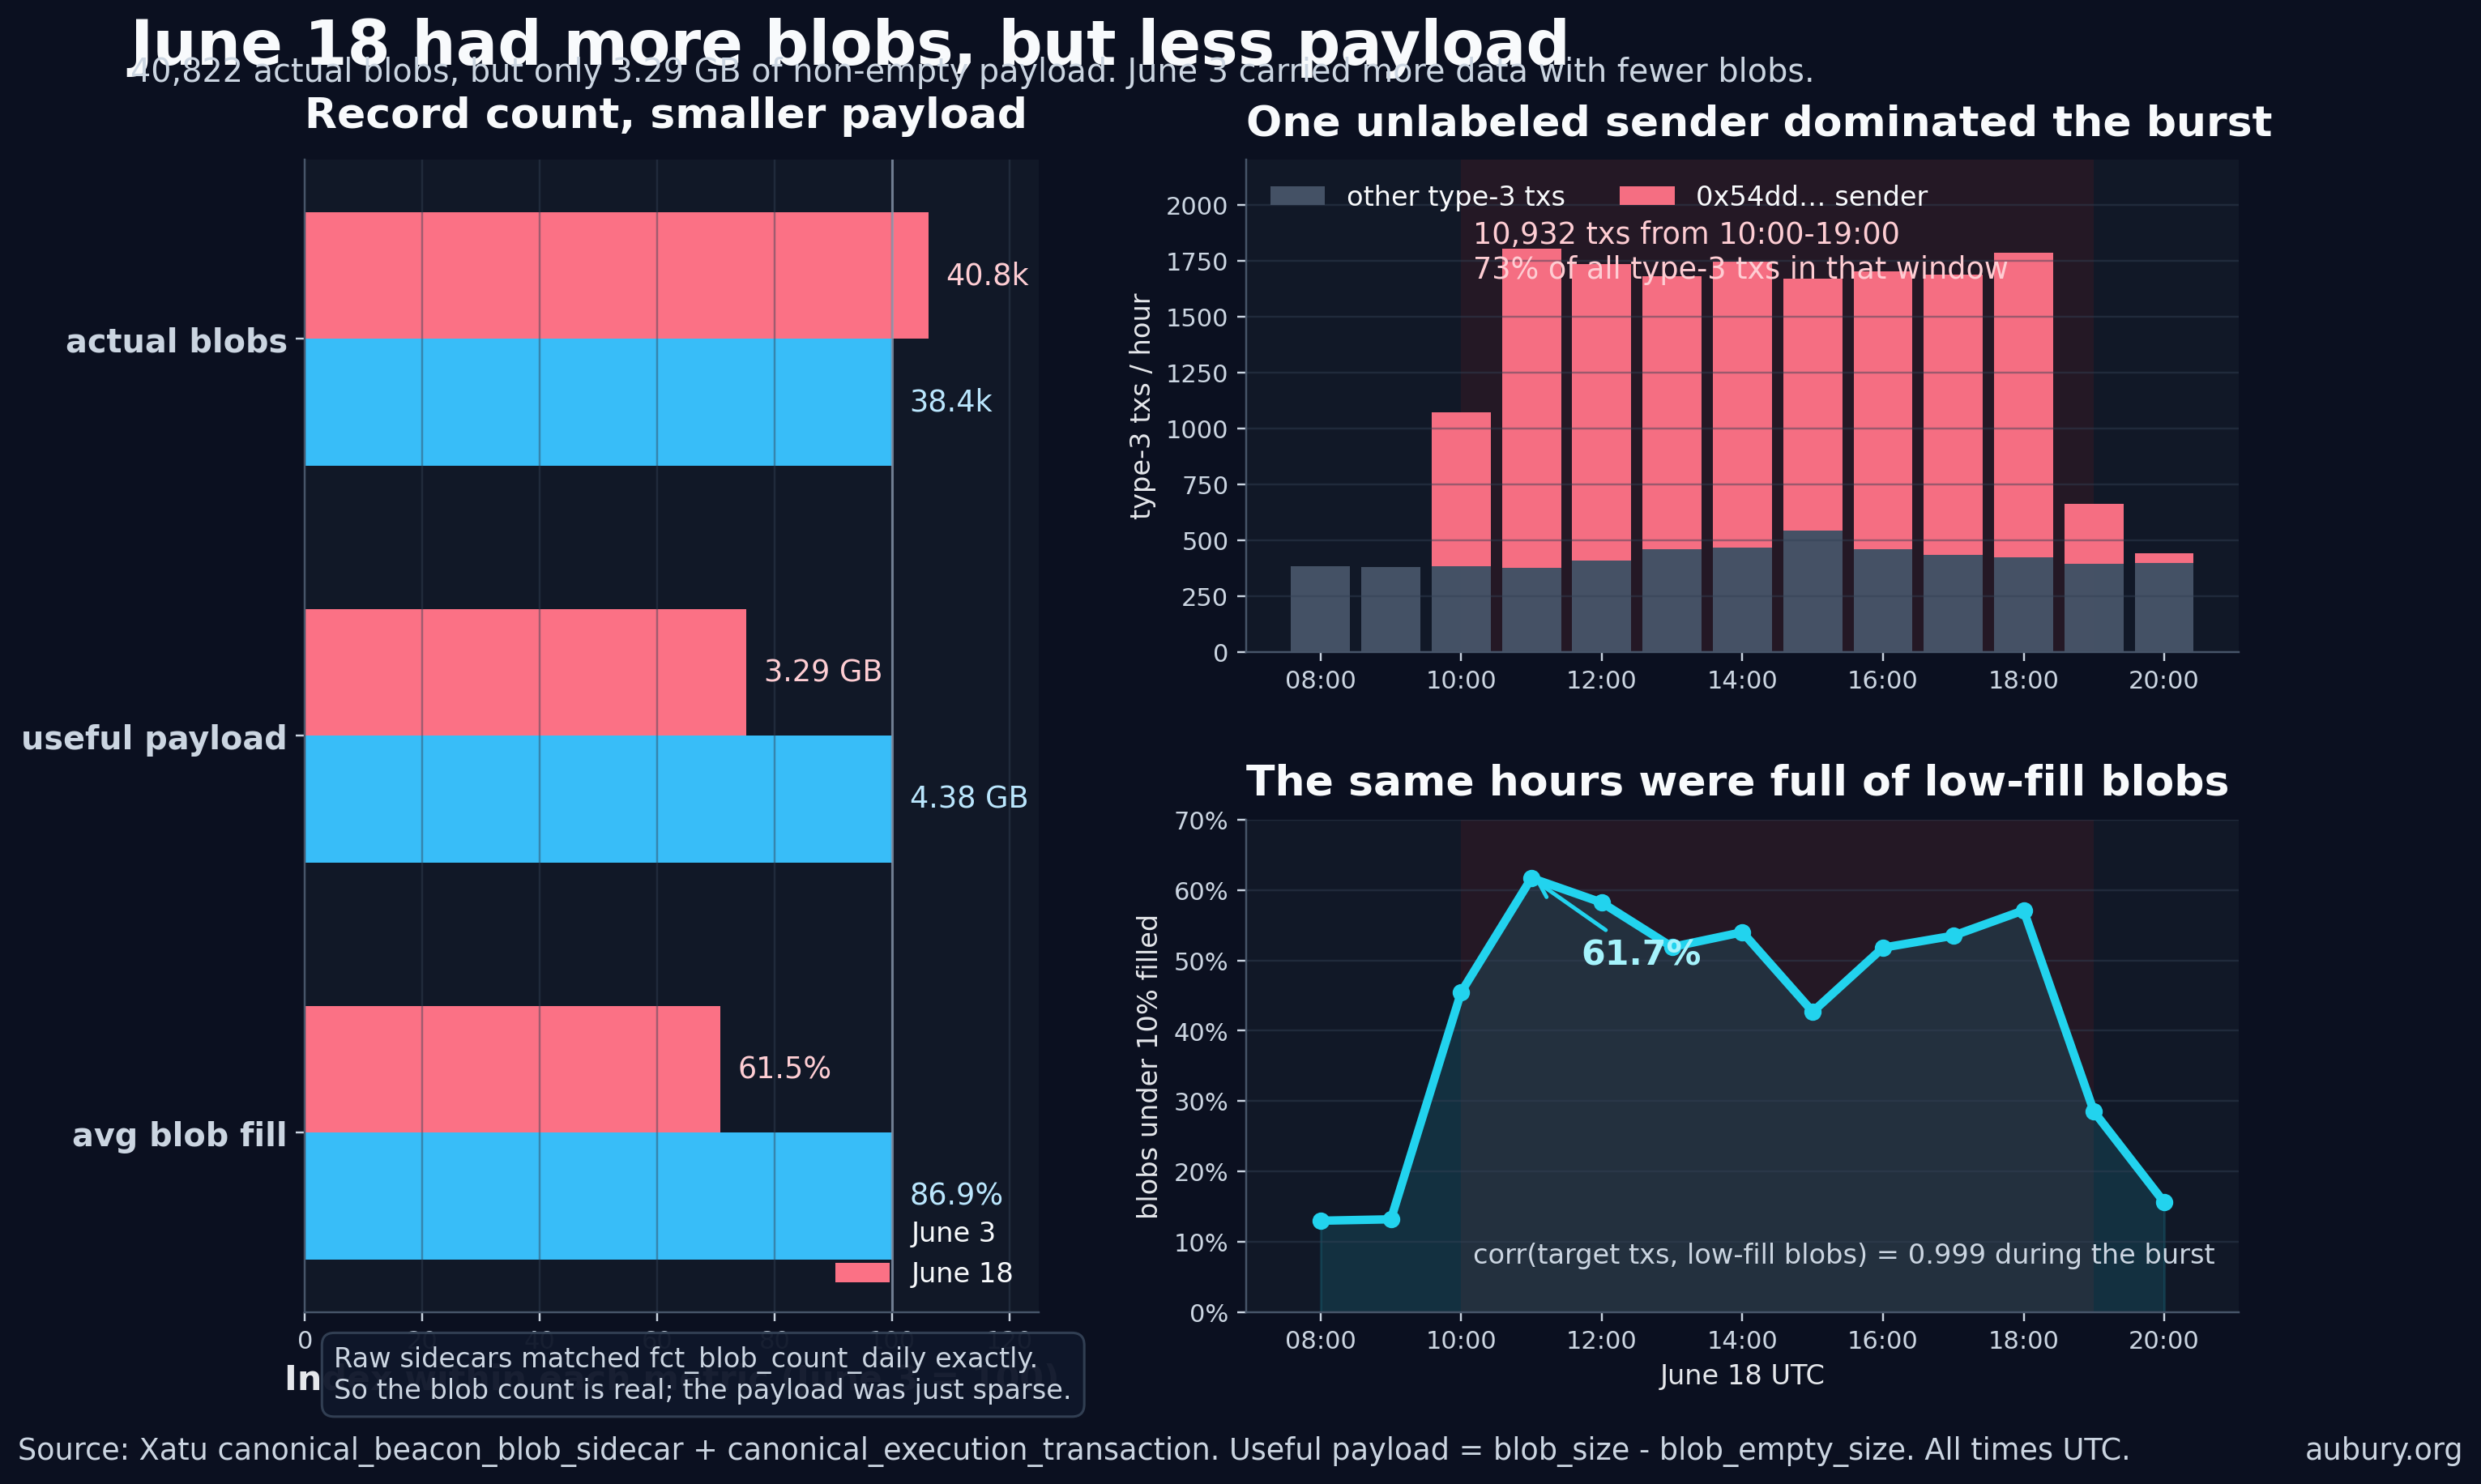
It was, technically. Ethereum carried 40,822 actual blobs that day, beating June 3's 38,445.
But the record was weirdly hollow. June 18 carried 25% less useful blob payload than June 3, even with more blobs.
This is the part I should have checked immediately after fixing the blob-count denominator bug. Counting blobs is not the same thing as measuring useful data.
A blob can be mostly empty.
Xatu's raw sidecar table has blob_size and blob_empty_size, so the measurement is straightforward enough:
SELECT
  toDate(slot_start_date_time) AS day,
  count() AS blobs,
  sum(blob_size - ifNull(blob_empty_size, 0)) AS useful_bytes,
  sum(blob_size) AS capacity_bytes,
  round(avg((blob_size - ifNull(blob_empty_size, 0)) / blob_size) * 100, 2) AS avg_fill_pct,
  countIf((blob_size - ifNull(blob_empty_size, 0)) / blob_size < 0.10) AS under_10pct
FROM canonical_beacon_blob_sidecar
WHERE meta_network_name = 'mainnet'
  AND slot_start_date_time >= toDateTime('2026-06-01 00:00:00')
  AND slot_start_date_time < toDateTime('2026-06-19 00:00:00')
GROUP BY day
ORDER BY day
June 3 had 38,445 blobs at 86.9% average fill. That works out to 4.38 GB of non-empty blob payload.
June 18 had 40,822 blobs at 61.5% average fill. That is only 3.29 GB of non-empty payload.
So the headline is annoying but true: more blobs, less data.
I cross-checked the count part against the refined daily aggregate, because I am not interested in publishing a second blob correction that needs a third blob correction:
SELECT
  day_start_date AS day,
  total_blobs
FROM mainnet.fct_blob_count_daily FINAL
WHERE day_start_date >= toDate('2026-06-01')
  AND day_start_date < toDate('2026-06-19')
ORDER BY day_start_date
The raw sidecar count and fct_blob_count_daily.total_blobs matched exactly for every day from June 1 through June 18. The weird part is not the blob count. The weird part is the fill.
June 18 had 14,787 blobs under 10% filled.
That is not normal background noise. The hourly view points at one sender.
SELECT
  block_number,
  count() AS target_txs
FROM canonical_execution_transaction
WHERE meta_network_name = 'mainnet'
  AND transaction_type = 3
  AND lower(from_address) = '0x54dd1659c232dec31386c52507982a4983d9bcb8'
  AND block_number BETWEEN <first_june18_block> AND <last_june18_block>
GROUP BY block_number
ORDER BY block_number
From 10:00 to 19:00 UTC, 0x54dd1659c232dec31386c52507982a4983d9bcb8 sent 10,932 type-3 transactions. That was 73% of all type-3 transactions in that nine-hour window.
I could not find a label for it in mainnet.dim_block_blob_submitter. So, for now, it is just 0x54dd..., which is ugly but honest.
The timing lines up too neatly to ignore. During the burst, hourly transactions from that address and hourly low-fill blob count had a correlation of 0.999. The low-fill share peaked at 61.7% at 11:00 UTC. The blob-count peak came later, at 15:00 UTC, with 2,971 blobs in one hour, but the average fill was only 54.8%.
That changes how I read the June 18 record.
The June 3 spike looked like rollups pushing more data through the blob lane. The June 18 spike looks more like someone spraying lots of sparse blobs.
Both count as blob demand. They are not the same load.
If you care about fee pressure, sidecar gossip, DAS sampling assumptions, or just what "blob usage" means, this distinction matters. A full blob and a mostly empty blob both consume a blob slot. They do not carry the same amount of data.
Blob count said June 18 was bigger.
Payload said June 3 was.