Plataberget's head counters recovered 4h50m before finality

Yesterday's Plataberget post stopped at 11:15 UTC with finality still pinned to epoch 1,534. I left the same 84 validator-node cohort in place and kept watching. The extra three hours made the head-count proxy look pretty bad.
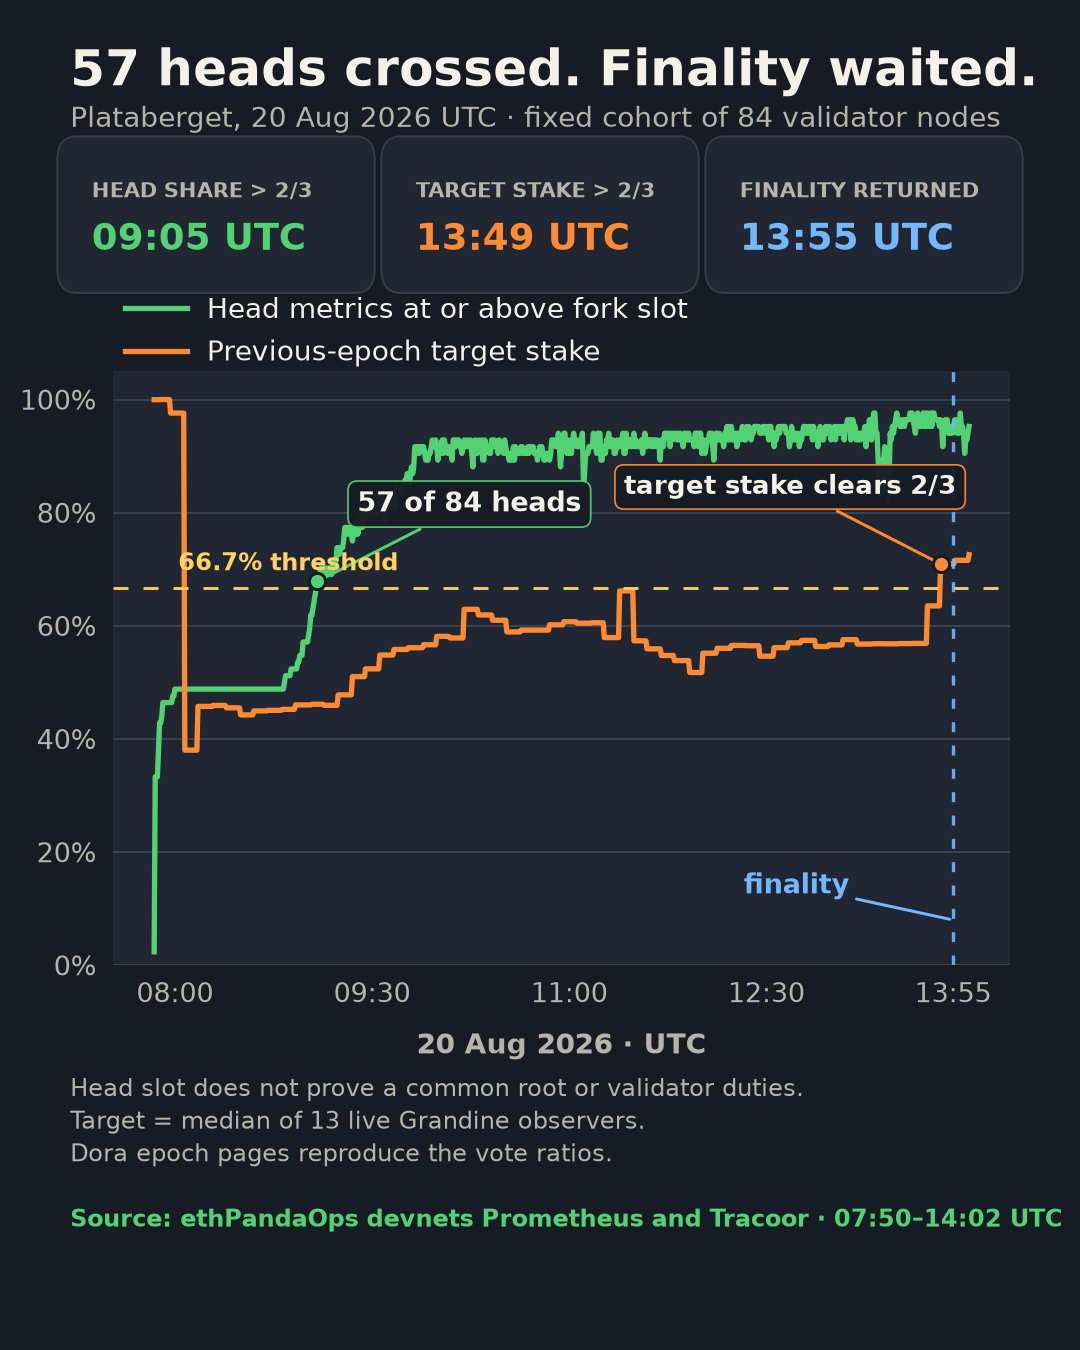
At 09:05, 57 of the 84 head gauges were already at or beyond the Gloas fork slot. That is 67.86% of the nodes, but the latest complete epoch had only 45.94% of eligible stake voting for the target. Finality did not return until 13:55, four hours and 50 minutes later.
A head counter is not a vote
The cohort is deliberately boring: 14 Grandine, 14 Lighthouse, 14 Lodestar, 14 Nimbus, 14 Prysm and 14 Teku nodes. I counted a node only when its beacon_head_slot gauge reached slot 49,152. A missing scrape stayed in the fixed denominator of 84, so a restart could not make the recovery share look better.
This is the Panda path I ran. The row grain of the first query is observer by scrape time; the target ratio keeps the same observer key and joins numerator to denominator at the exact timestamp.
from ethpandaops import prometheus
from statistics import median

network = "glamsterdam-devnet-8"
selector = (
    f'network="{network}",job="consensus_node",supernode="True"'
)

heads = prometheus.query_range(
    "devnets",
    f'beacon_head_slot{{{selector}}}',
    start="2026-08-20T07:50:00Z",
    end="2026-08-20T14:03:00Z",
    step="30s",
)["result"]

# Fixed denominator: missing scrape = not crossed.
by_time = {}
for series in heads:
    instance = series["metric"]["instance"]
    for ts, value in series["values"]:
        by_time.setdefault(float(ts), {})[instance] = float(value)

head_share = [
    (ts, sum(slot >= 49_152 for slot in rows.values()) / 84)
    for ts, rows in sorted(by_time.items())
]

# Grandine exposes the stake numerator and denominator with the same labels.
target = prometheus.query_range(
    "devnets",
    f'beacon_participation_prev_epoch_target_attesting_gwei_total{{{selector}}}',
    start="2026-08-20T07:50:00Z",
    end="2026-08-20T14:03:00Z",
    step="30s",
)["result"]
active = prometheus.query_range(
    "devnets",
    f'beacon_participation_prev_epoch_active_gwei_total{{{selector}}}',
    start="2026-08-20T07:50:00Z",
    end="2026-08-20T14:03:00Z",
    step="30s",
)["result"]

# I retained the 13 Grandine observers that crossed the fork, joined each
# instance at exact scrape time, then took the cross-observer median.
The 57th head gauge crossed at 09:05 with 77 nodes reporting. By 12:12, 80 of 84 were across and all 84 were reporting. The median Grandine target-stake gauge was still below two-thirds; it first reported 70.9509% at 13:49.
That gap is the whole story. A head-slot gauge says a local client processed far enough to report a slot number. It does not say the node shares a state root with the useful chain, and it definitely does not say the attached validators are casting correct target votes.
The stake crossed in two consecutive epochs
The public Dora epoch pages give a cleaner canonical cross-check. Epoch 1,589 was still short at 1,723,392 of 2,713,088 ETH. Epochs 1,590 and 1,591 both cleared the line:
- Epoch 1,589: 1,723,392 / 2,713,088 ETH = 63.5214%.
- Epoch 1,590: 1,924,960 / 2,713,088 ETH = 70.9509%.
- Epoch 1,591: 1,941,920 / 2,713,088 ETH = 71.5760%.
- Epoch 1,592: 1,969,088 / 2,713,088 ETH = 72.5774%.
The displayed eligible denominator did not move across those four epochs. The recovery came from more stake voting for the target, not from the denominator visibly shrinking under it.
At slot 50,976, the first block of epoch 1,593, the finalized checkpoint jumped from 1,534 to 1,590. All six client metric families reported that same checkpoint jump. The block landed at 13:55:12 UTC, six hours, four minutes and 48 seconds after the fork.
Tracoor caught the exact boundary too. Sixteen captures agreed on block root 0x1715…4fd4 and state root 0xd7ce…1444. A later Lighthouse-Besu capture at the same slot had a different local state root and no matching block capture. That is not proof of a second block, but it is a tidy demonstration that head_slot = 50976 is not a common-state proof.
The Prysm fix arrived inside the recovery window
Prysm's failure now has a concrete code path. OnboardBuildersFromPendingDeposits rescanned and reverified earlier same-pubkey deposits for every builder candidate. Plataberget's pending-deposit shape turned that into millions of redundant BLS signature checks at the fork.
The merged fix caches pending-validator status by pubkey and verifies each deposit at most once. One Prysm node exposed the PR head commit at 10:48; the other 13 exposed the merge commit between 13:21 and 13:26. By 13:26:30, all 14 Prysm version gauges were on code containing the fix. The target-stake metric crossed two-thirds 23 minutes later.
That timing is compatible with the rollout helping the vote recovery, but I cannot turn it into a clean attribution. Other clients restarted and caught up in the same window, while the metrics here do not map every returning validator duty to one client process. The honest claim is narrower: the broken quadratic path explains the Prysm stalls, the fixed build reached the full Prysm cohort before finality returned, and voting stake recovered shortly afterwards.
The useful dashboard order is head, target, checkpoint. Plataberget separated those three clocks by hours. Calling the network "two-thirds recovered" after the first one would have been flat wrong.