Plataberget's BAL grew 3.5x without more items

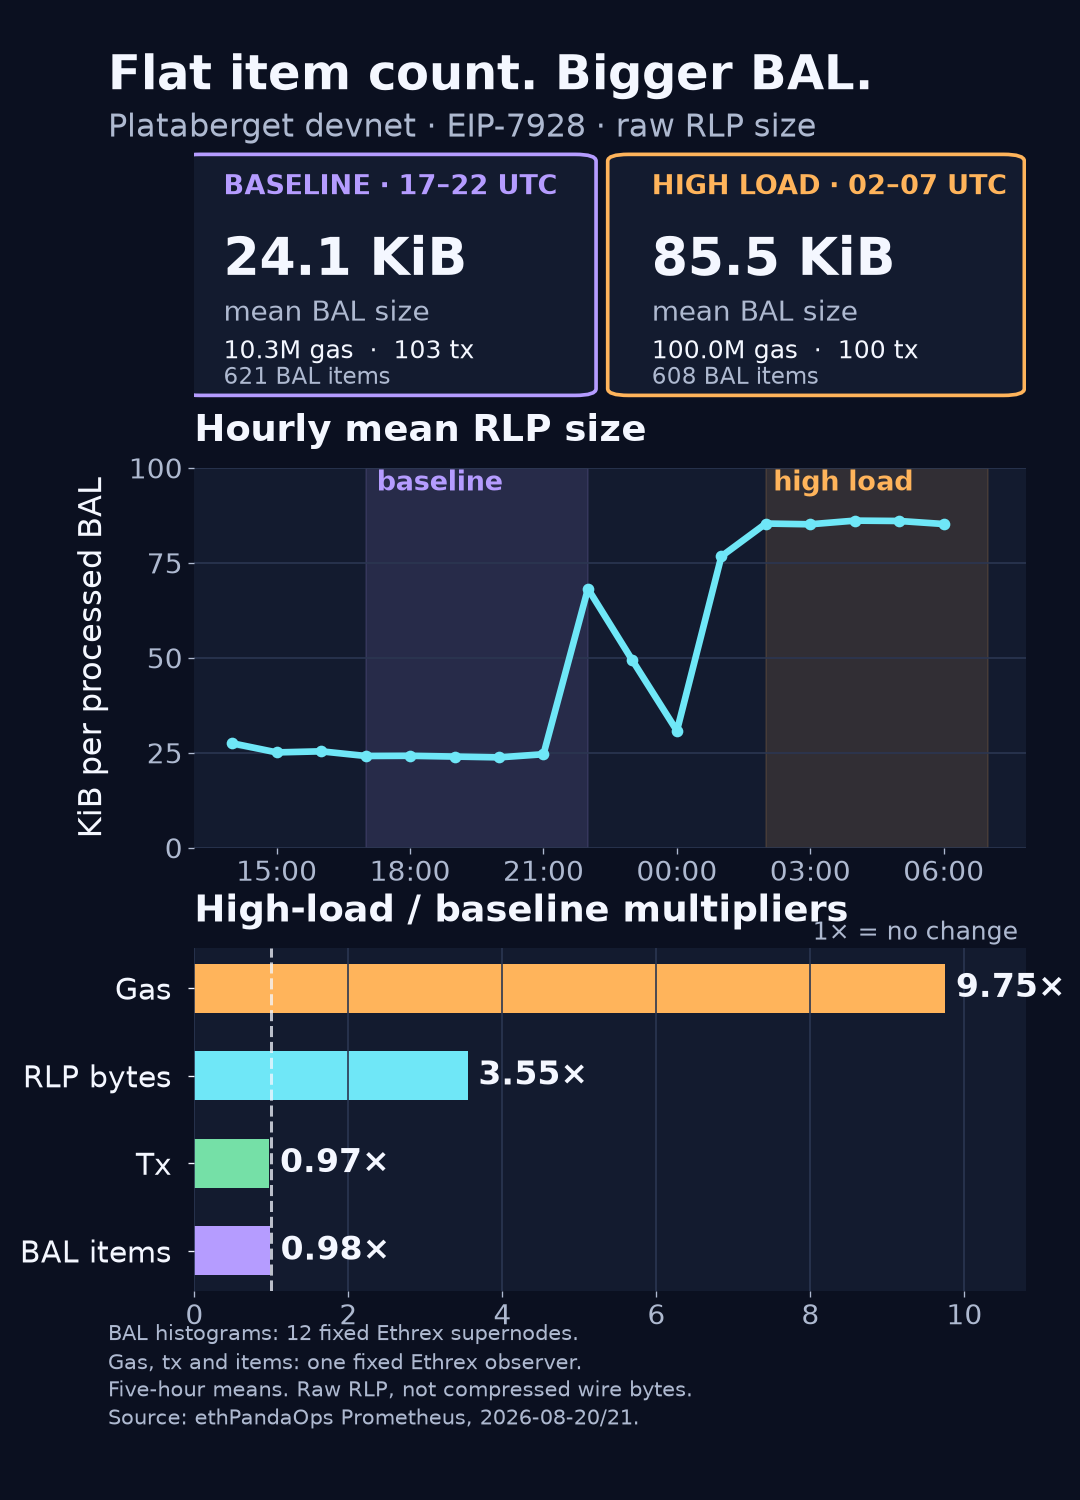
Plataberget spent five hours producing block access lists around 24 KiB. A few hours later they had settled near 86 KiB, yet the lists still held roughly the same number of unique addresses and storage keys.
That is the part I did not expect. The devnet pushed almost ten times more gas through each block without adding more transactions or more BAL items. The extra 61 KiB went into the payload hanging off those items.
EIP-7928 adds a block-level access list, or BAL, to each execution block. It records every accessed account and storage key, plus the post-transaction values needed to reconstruct state changes. The proposal is still in Review; Plataberget is a development network, not a preview of ordinary mainnet traffic.
Still, this is the first live workload I have seen where the byte size and the item count pull this far apart.
The average hides two different networks
I measured the first 23 complete post-fork hours, from 08:00 UTC on August 20 through 07:00 UTC on August 21. Twelve fixed Ethrex supernodes exposed a histogram of the RLP-encoded BAL size. The median node processed 5,930 BAL-carrying blocks, and on every node the histogram count matched bal_blocks_total exactly.
Across the whole window, the median per-node mean was 46.9 KiB. That number is technically fine and practically useless. It blends a low-load stretch near 24 KiB with a later stress phase near 86 KiB.
Here is the histogram path used for the all-block size series:
from ethpandaops import prometheus

selector = (
    'network="glamsterdam-devnet-8",'
    'execution_client="ethrex",supernode="True"'
)

count = prometheus.query_range(
    "devnets",
    f'increase(bal_size_bytes_histogram_count{{{selector}}}[1h])',
    start="2026-08-20T08:00:00Z",
    end="2026-08-21T07:00:00Z",
    step="1h",
)
size_sum = prometheus.query_range(
    "devnets",
    f'increase(bal_size_bytes_histogram_sum{{{selector}}}[1h])',
    start="2026-08-20T08:00:00Z",
    end="2026-08-21T07:00:00Z",
    step="1h",
)

# For each node and hour:
mean_bal_kib = increase_size_sum / increase_count / 1024
I froze two five-hour windows after all 12 nodes had continuous coverage. Between 17:00 and 22:00 UTC, their median hourly mean was 24.1 KiB. Between 02:00 and 07:00 UTC, it was 85.5 KiB: 3.55 times larger.
The node range was tight during the high-load run. Hourly means sat between 85.0 and 86.1 KiB across the cohort, so this is not one observer reporting a strange local block.
Ten times the gas, almost the same access set
Ethrex also exports per-block gauges for gas used, transaction count, BAL account count, BAL slot count, and the latest RLP size. I joined those gauges by scrape timestamp on one fixed Grandine/Ethrex observer, then kept one sample per execution block number. A 15-second scrape does not catch every 12-second block, so I used this path for workload shape, not for the all-block byte average above.
The baseline window contained 600 sampled blocks; the high-load window contained 599. Their five-hour means were blunt:
- Gas used rose from 10.3 million to 100.0 million per block, a 9.75x increase.
- Raw BAL RLP grew from roughly 24.3 KiB to 85.6 KiB on the sampled path, agreeing with the 12-node histogram result.
- Transaction count moved from 103 to 100.
- BAL items, defined as unique addresses plus unique storage keys, moved from 621 to 608.
The per-block sample looked like this:
metrics = [
    "block_number", "gas_used", "transaction_count",
    "bal_size_bytes", "bal_account_count", "bal_slot_count",
]

series = {
    name: prometheus.query_range(
        "devnets",
        f'{name}{{network="glamsterdam-devnet-8",'
        'instance="glamsterdam-devnet-8-grandine-ethrex-2"}',
        start="2026-08-20T08:00:00Z",
        end="2026-08-21T07:00:00Z",
        step="15s",
    )
    for name in metrics
}

# Merge on scrape timestamp, then keep one row per block_number.
bal_items = bal_account_count + bal_slot_count
The sampled BAL size had a 0.76 correlation with gas used, but only 0.33 with transaction count. That fits the two stable windows: the high-load blocks did much more work inside roughly 100 transactions while touching slightly fewer unique BAL items.
An item is not a byte budget
The distinction comes straight from the proposal. EIP-7928 limits bal_items to block_gas_limit // 2000, where an item is one address or one unique storage key. Ethrex's metric follows that definition: item_count() counts addresses, storage reads, and unique changed slots.
But the RLP carries more than those keys. A changed storage slot can hold several transaction-indexed post-values, and accounts can carry balance, nonce, and code change lists. Ethrex measures the encoded object directly with bal_ref.length(), while its bal_size_bytes documentation calls the value raw RLP bytes.
So the item count can stay flat while repeated changes make the encoded lists much fatter. The telemetry does not expose a byte breakdown by storage, balance, nonce, and code, which means I cannot pin all 61 KiB on repeated storage writes. I can say where it did not come from: it was not a larger set of addresses or storage keys.
There is one last unit trap. EIP-7928 cites a 72.4 KiB compressed estimate for a 60 million gas mainnet backcast. The Ethrex gauge is uncompressed RLP, and Plataberget was running a synthetic workload near 100 million gas. Putting those numbers in one leaderboard would be tidy and wrong.
The live result is narrower. On this devnet, the count-based BAL cap barely moved while the serialized object grew 3.5 times. If operators want a useful bandwidth alarm, they need the bytes, not just the items.