PeerDAS made 21-blob blocks boring
I expected the 21-blob blocks to look ugly.
They don't. At least not in the median case.
Over the last two weeks, mainnet produced enough fat blob blocks to stop hand-waving about PeerDAS row count. I looked at slots where all 128 data columns showed up in mainnet.fct_block_data_column_sidecar_first_seen, then grouped them by row_count. In that table, row_count is the number of rows in the data column sidecar, which is the blob/KZG commitment count for the block.
One blob: all 128 columns first seen at 1.36s median.
Twenty-one blobs: 1.68s median.
That is the part I did not expect. Going from 1 blob to 21 blobs added 323 ms to the median time for the full set of columns to show up. The 19-21 blob bucket was 1.681s at p50, with 798 slots in the sample. Still comfortably below the 3s zone where attestation head votes start getting weird.
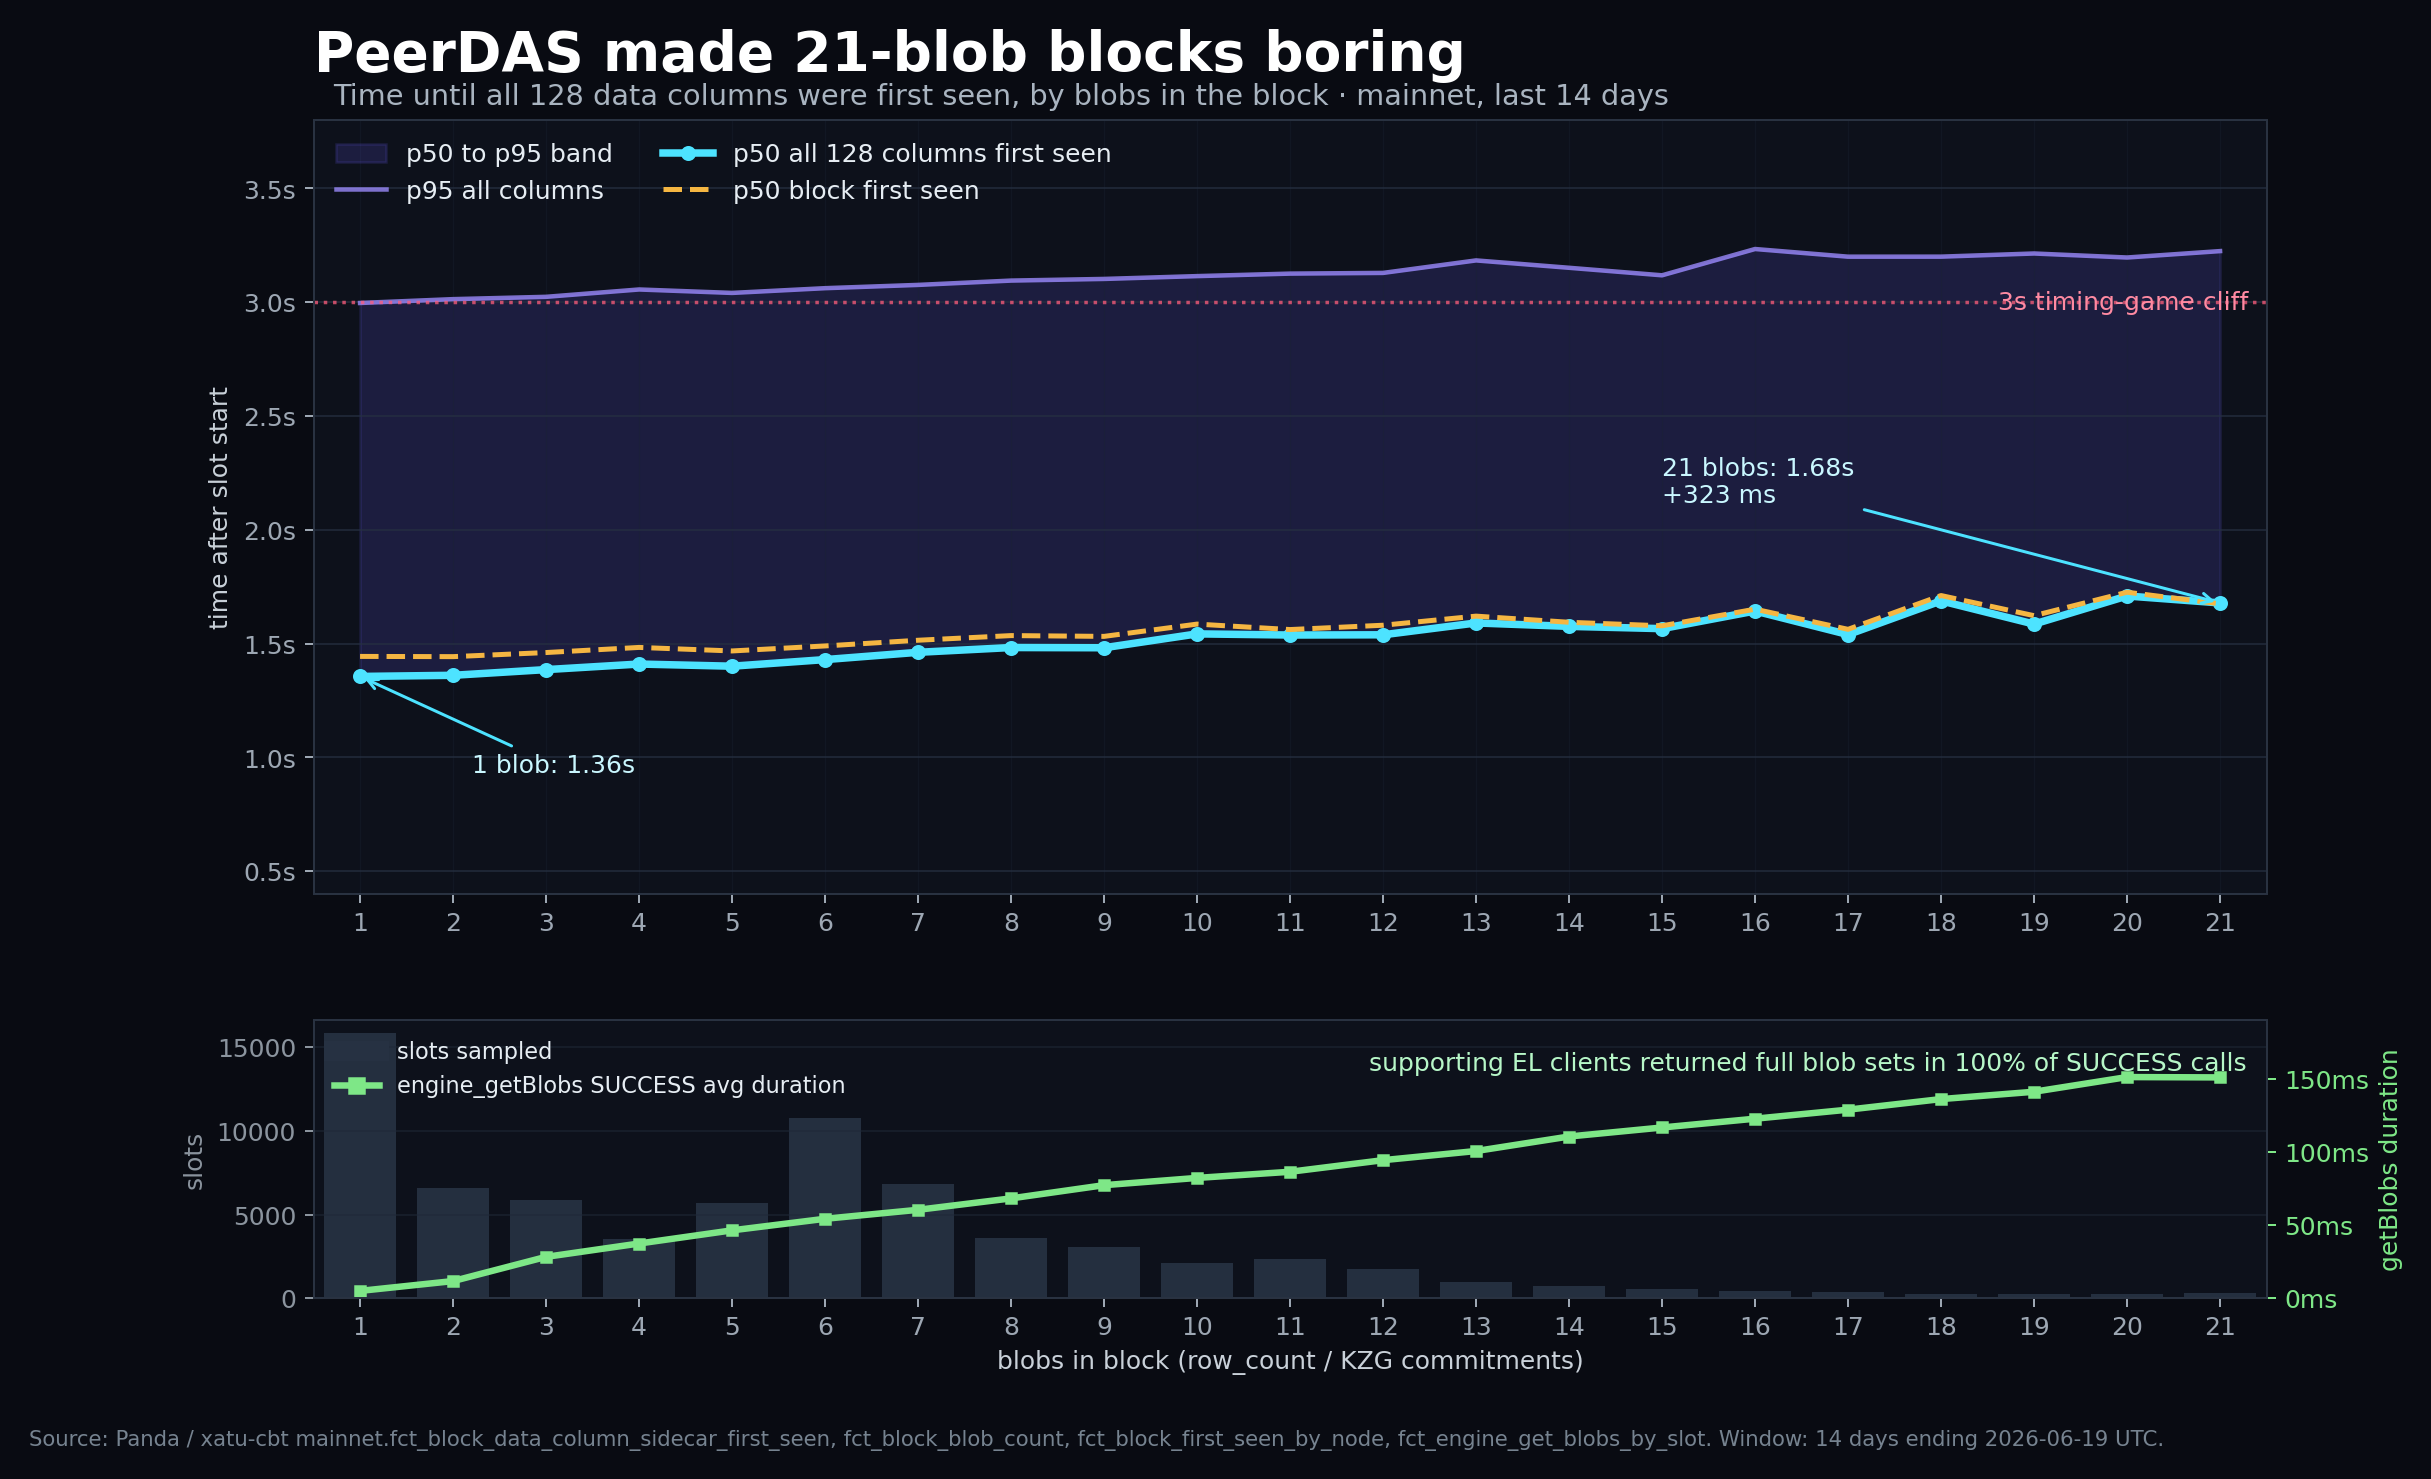
The annoying bit is the tail. The 19-21 blob bucket had a p95 of 3.215s. So, yes, there are still late ugly blocks. But the median story is not "21 blobs melt gossip." It is much more boring:
- 1-6 blob blocks: 1.390s p50 for all 128 columns, 3.028s p95
- 7-12 blob blocks: 1.495s p50, 3.101s p95
- 13-18 blob blocks: 1.589s p50, 3.170s p95
- 19-21 blob blocks: 1.681s p50, 3.215s p95
The within-slot column spread grows too, but not by much. For 1-6 blob blocks, the median gap between the first column and the last column was 50 ms. For 19-21 blob blocks it was 114 ms.
That is the row-count tax. It exists. It is just small.
Here is the query I used for the main line in the chart:
WITH per_slot AS (
  SELECT
    slot,
    any(row_count) AS blob_count,
    countDistinct(column_index) AS columns_seen,
    min(seen_slot_start_diff) AS first_col_ms,
    quantileExact(0.50)(seen_slot_start_diff) AS median_col_ms,
    max(seen_slot_start_diff) AS last_col_ms
  FROM mainnet.fct_block_data_column_sidecar_first_seen FINAL
  WHERE slot_start_date_time >= now() - INTERVAL 14 DAY
    AND seen_slot_start_diff BETWEEN 0 AND 12000
    AND row_count > 0
  GROUP BY slot
  HAVING columns_seen = 128
)
SELECT
  blob_count,
  count() AS slots,
  quantileExact(0.50)(last_col_ms) AS all_columns_p50_ms,
  quantileExact(0.95)(last_col_ms) AS all_columns_p95_ms,
  quantileExact(0.50)(last_col_ms - first_col_ms) AS spread_p50_ms
FROM per_slot
GROUP BY blob_count
ORDER BY blob_count;
I cross-checked the count three ways because blob units have bitten me once this week already.
row_count matched mainnet.fct_block_blob_count.blob_count for 99.68% of the 72,194 rows in the 14-day window. The small mismatch was from rows missing on one side near the head/finalization edge, not a different scale.
The raw Xatu table told the same story over the last 48 hours:
WITH per_col AS (
  SELECT
    slot,
    kzg_commitments_count AS blob_count,
    column_index,
    min(propagation_slot_start_diff) AS first_seen_ms
  FROM libp2p_gossipsub_data_column_sidecar
  WHERE meta_network_name = 'mainnet'
    AND slot_start_date_time >= now() - INTERVAL 48 HOUR
    AND propagation_slot_start_diff BETWEEN 0 AND 12000
    AND kzg_commitments_count > 0
  GROUP BY slot, blob_count, column_index
), per_slot AS (
  SELECT
    slot,
    any(blob_count) AS blob_count,
    countDistinct(column_index) AS columns_seen,
    min(first_seen_ms) AS first_col_ms,
    max(first_seen_ms) AS last_col_ms
  FROM per_col
  GROUP BY slot
  HAVING columns_seen = 128
)
SELECT
  multiIf(
    blob_count <= 6, '1-6',
    blob_count <= 12, '7-12',
    blob_count <= 18, '13-18',
    '19-21'
  ) AS bucket,
  count() AS slots,
  quantileExact(0.50)(last_col_ms) AS all_columns_p50_ms,
  quantileExact(0.95)(last_col_ms) AS all_columns_p95_ms
FROM per_slot
GROUP BY bucket
ORDER BY bucket;
The raw table came out a little slower, as expected from a lower-level event path, but the shape was the same: 1.483s p50 for 1-6 blobs, 1.842s p50 for 19-21 blobs.
The engine side was also boring. For execution clients that returned SUCCESS to engine_getBlobs, the full blob set came back 100% of the time in every bucket. Average successful call duration rose from 27 ms in the 1-6 blob bucket to 148 ms in the 19-21 bucket.
That is not free. It is also not the thing currently blowing the slot budget.
The slightly weird part is that the data columns are not obviously lagging behind the block. At median, the full 128-column set is basically there by the time the block itself is first seen by the sentry nodes:
- 1-6 blobs: data columns complete at 1.390s, block first seen at 1.463s
- 19-21 blobs: data columns complete at 1.681s, block first seen at 1.685s
This is not a causal claim. These are separate gossip observations from monitoring nodes. But it does kill the simple mental model where the block arrives first and then the data slowly trails in after it. In the normal case, PeerDAS data is riding right beside the block.
So the scary version of the 21-blob story did not show up.
The p95 still matters. Late blocks are still late blocks. If a proposer publishes near the timing-game cliff, the extra couple hundred milliseconds from big blob count can make the tail uglier.
But the median 21-blob block is not a crisis.
It is just another 1.7-second block with more rows.