Gloas's two payload clocks measure different things

Grandine and Lodestar did not validate a Gloas payload in zero milliseconds. The telemetry just made it look that way.
Gloas adds two useful-looking Beacon API events. execution_payload_gossip says a signed payload envelope passed gossip validation. execution_payload_available says the payload and its blobs are locally ready for a payload-timeliness-committee vote. Subtract the first timestamp from the second and you get something that looks a lot like a client benchmark.
It is not one.
The zero is the problem
I joined five complete UTC days of Platåberget data, from August 21 through the start of August 26. The payload model contained 31,910 distinct (slot, block_root) rows and 224,876 blob commitments inside a physical ceiling of 36,000 scheduled slots. I kept observers that had an exact first-signal/availability pair for at least 95% of those roots, which left 13 to 16 nodes for each of the six clients.
At the intended (slot, block_root, node_id) grain, the result was not subtle:
- Grandine: p50
0 ms, p900 ms; 93.8% of pairs were zero or negative. - Lodestar: p50
0 ms, p901 ms; 79.9% were zero or negative. - Prysm: p50
6 ms, p9015 ms. - Lighthouse: p50
58 ms, p90129 ms. - Teku: p50
65 ms, p90166 ms. - Nimbus: p50
241 ms, p90468 ms.
Those are node-block observations, not slots pretending to be nodes or nodes pretending to be a network. Each aggregate's row count matched uniqExact((slot, root, node_id)). I also kept both clocks inside the physical 0–12,000 ms slot window and subtracted them as signed Int64; subtracting the stored unsigned fields directly would turn a small negative gap into nonsense.
The fixed cohort and the chart came from this query. The 30,315-root threshold is ceil(0.95 × 31,910).
WITH first_seen AS (
  SELECT slot, block_root, node_id, seen_slot_start_diff
  FROM `glamsterdam-devnet-8`.fct_block_payload_first_seen_by_node FINAL
  WHERE slot_start_date_time >= toDateTime('2026-08-21 00:00:00')
    AND slot_start_date_time <  toDateTime('2026-08-26 00:00:00')
    AND seen_slot_start_diff <= 12000
), payloads AS (
  SELECT slot, block_root, blob_kzg_commitment_count
  FROM `glamsterdam-devnet-8`.fct_block_payload FINAL
  WHERE slot_start_date_time >= toDateTime('2026-08-21 00:00:00')
    AND slot_start_date_time <  toDateTime('2026-08-26 00:00:00')
), paired AS (
  SELECT
    a.meta_consensus_implementation AS implementation,
    a.node_id AS observer_id,
    a.slot AS payload_slot,
    a.block_root AS payload_root,
    p.blob_kzg_commitment_count AS blob_count,
    toInt64(a.available_slot_start_diff)
      - toInt64(f.seen_slot_start_diff) AS gap_ms
  FROM `glamsterdam-devnet-8`.fct_block_payload_available_by_node AS a FINAL
  GLOBAL INNER JOIN first_seen AS f
    ON a.slot = f.slot
   AND a.block_root = f.block_root
   AND a.node_id = f.node_id
  GLOBAL INNER JOIN payloads AS p
    ON a.slot = p.slot
   AND a.block_root = p.block_root
  WHERE a.slot_start_date_time >= toDateTime('2026-08-21 00:00:00')
    AND a.slot_start_date_time <  toDateTime('2026-08-26 00:00:00')
    AND a.available_slot_start_diff <= 12000
), eligible AS (
  SELECT observer_id
  FROM paired
  GROUP BY observer_id
  HAVING uniqExact((payload_slot, payload_root)) >= 30315
)
SELECT
  p.implementation,
  p.blob_count,
  count() AS node_block_pairs,
  uniqExact((p.payload_slot, p.payload_root, p.observer_id))
    AS unique_node_block_pairs,
  uniqExact(p.observer_id) AS observers,
  quantilesExact(0.5, 0.9)(p.gap_ms) AS gap_quantiles_ms,
  round(100.0 * countIf(p.gap_ms <= 0) / node_block_pairs, 3)
    AS nonpositive_pct
FROM paired AS p
GLOBAL INNER JOIN eligible AS e
  ON p.observer_id = e.observer_id
WHERE p.blob_count IN (0, 1, 3, 5, 7, 9, 12, 15)
GROUP BY p.implementation, p.blob_count
HAVING node_block_pairs >= 100
ORDER BY p.implementation, p.blob_count
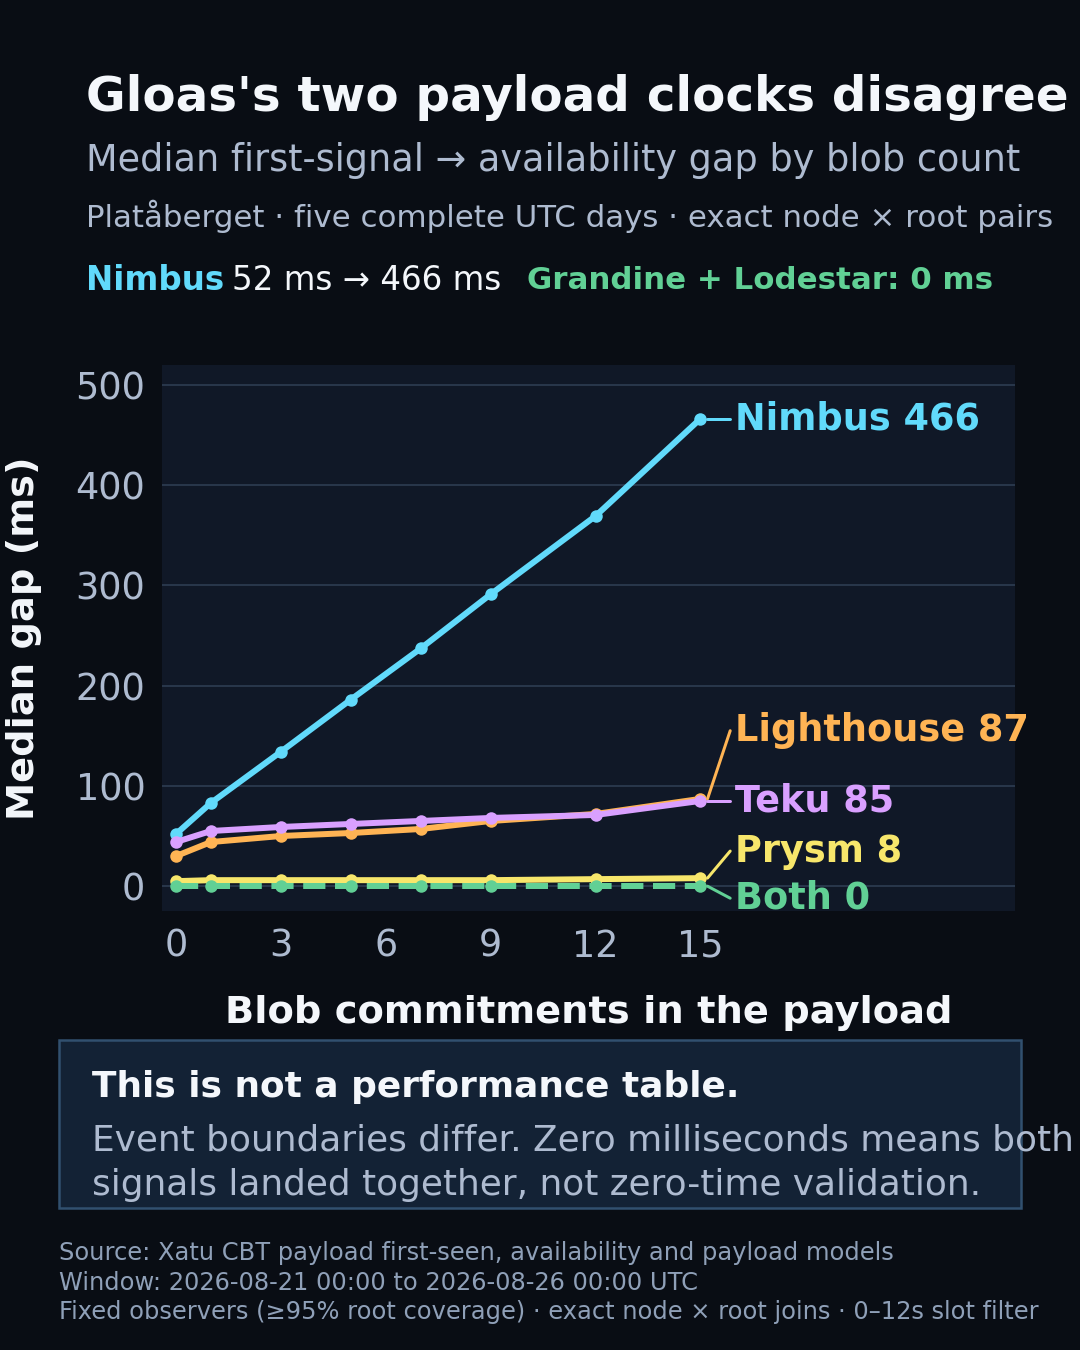
Blob count makes the boundary problem harder to ignore. Nimbus's median rose from 52 ms at zero commitments to 466 ms at 15. Lighthouse moved from 30 ms to 87 ms, Teku from 44 ms to 85 ms, and Prysm from 5 ms to 8 ms. Grandine and Lodestar stayed at a 0 ms median across every plotted bucket.
That flat zero line cannot describe the same span of work as Nimbus's rising line. It says the exported events sit on different sides of client-specific processing, or at least reach the collector with different timestamp boundaries. Calling the gap "payload verification time" would turn an instrumentation difference into a leaderboard.
The raw feed does the same thing
The refined model chooses the earliest captured payload signal. That union could have been the culprit, so I repeated the comparison directly on the raw Beacon API SSE tables for the complete August 25 UTC day. I reduced each table to its earliest row at exact (slot, block_root, meta_client_name) grain, kept both events inside the same 12-second slot, and joined the two event types locally in ClickHouse.
The raw path reproduced the shape. Grandine had 99,274 exact event pairs with p50/p90 of 0/0 ms; 94.1% were zero or negative. Lodestar had 101,931 pairs at 0/1 ms, with 77.2% zero or negative. Nimbus was still 282/537 ms, Lighthouse 64/137 ms, Teku 76/181 ms, and Prysm 7/17 ms.
This was not an orphan-only accident either. Joining the payload roots to fct_block accounted for 28,035 canonical roots and 3,874 orphaned roots, with one payload row unmatched. Client medians were effectively unchanged when I split the two statuses: Grandine and Lodestar remained 0 ms; Lighthouse was 58 ms in both; Prysm was 6 ms in both; Nimbus moved from 241 to 253 ms; Teku moved from 66 to 64 ms.
Keep the ugly label
The public event definitions are clear about the intended categories. Lodestar's current event types describe the gossip event as a payload envelope that passed topic validation and the availability event as payload plus blobs ready for a PTC vote. Prysm's gossip path also emits its gossip event after validation. Xatu labels these tables as pre-release Glamsterdam telemetry, which is the right warning label.
I did not prove the exact internal phase that Grandine or Lodestar includes in each timestamp. The measurements prove the observable contract is not uniform enough for cross-client timing claims. This is devnet telemetry, not a Mainnet incident, and no client should be called faster from this chart.
For now, the honest metric name is available_event_time - first_captured_payload_signal. It is ugly because the boundary is ugly. Fix the event contract first; benchmark whatever is left after that.