engine_getBlobsV2 is still fragmented
The blob data is there.
The Engine API path to fetch it is not equally there.
Over the last two weeks, regular validator-node observations in mainnet.int_engine_get_blobs made 1,103,621 engine_getBlobsV2 calls. 312,530 came back UNSUPPORTED.
No PARTIAL. No EMPTY.
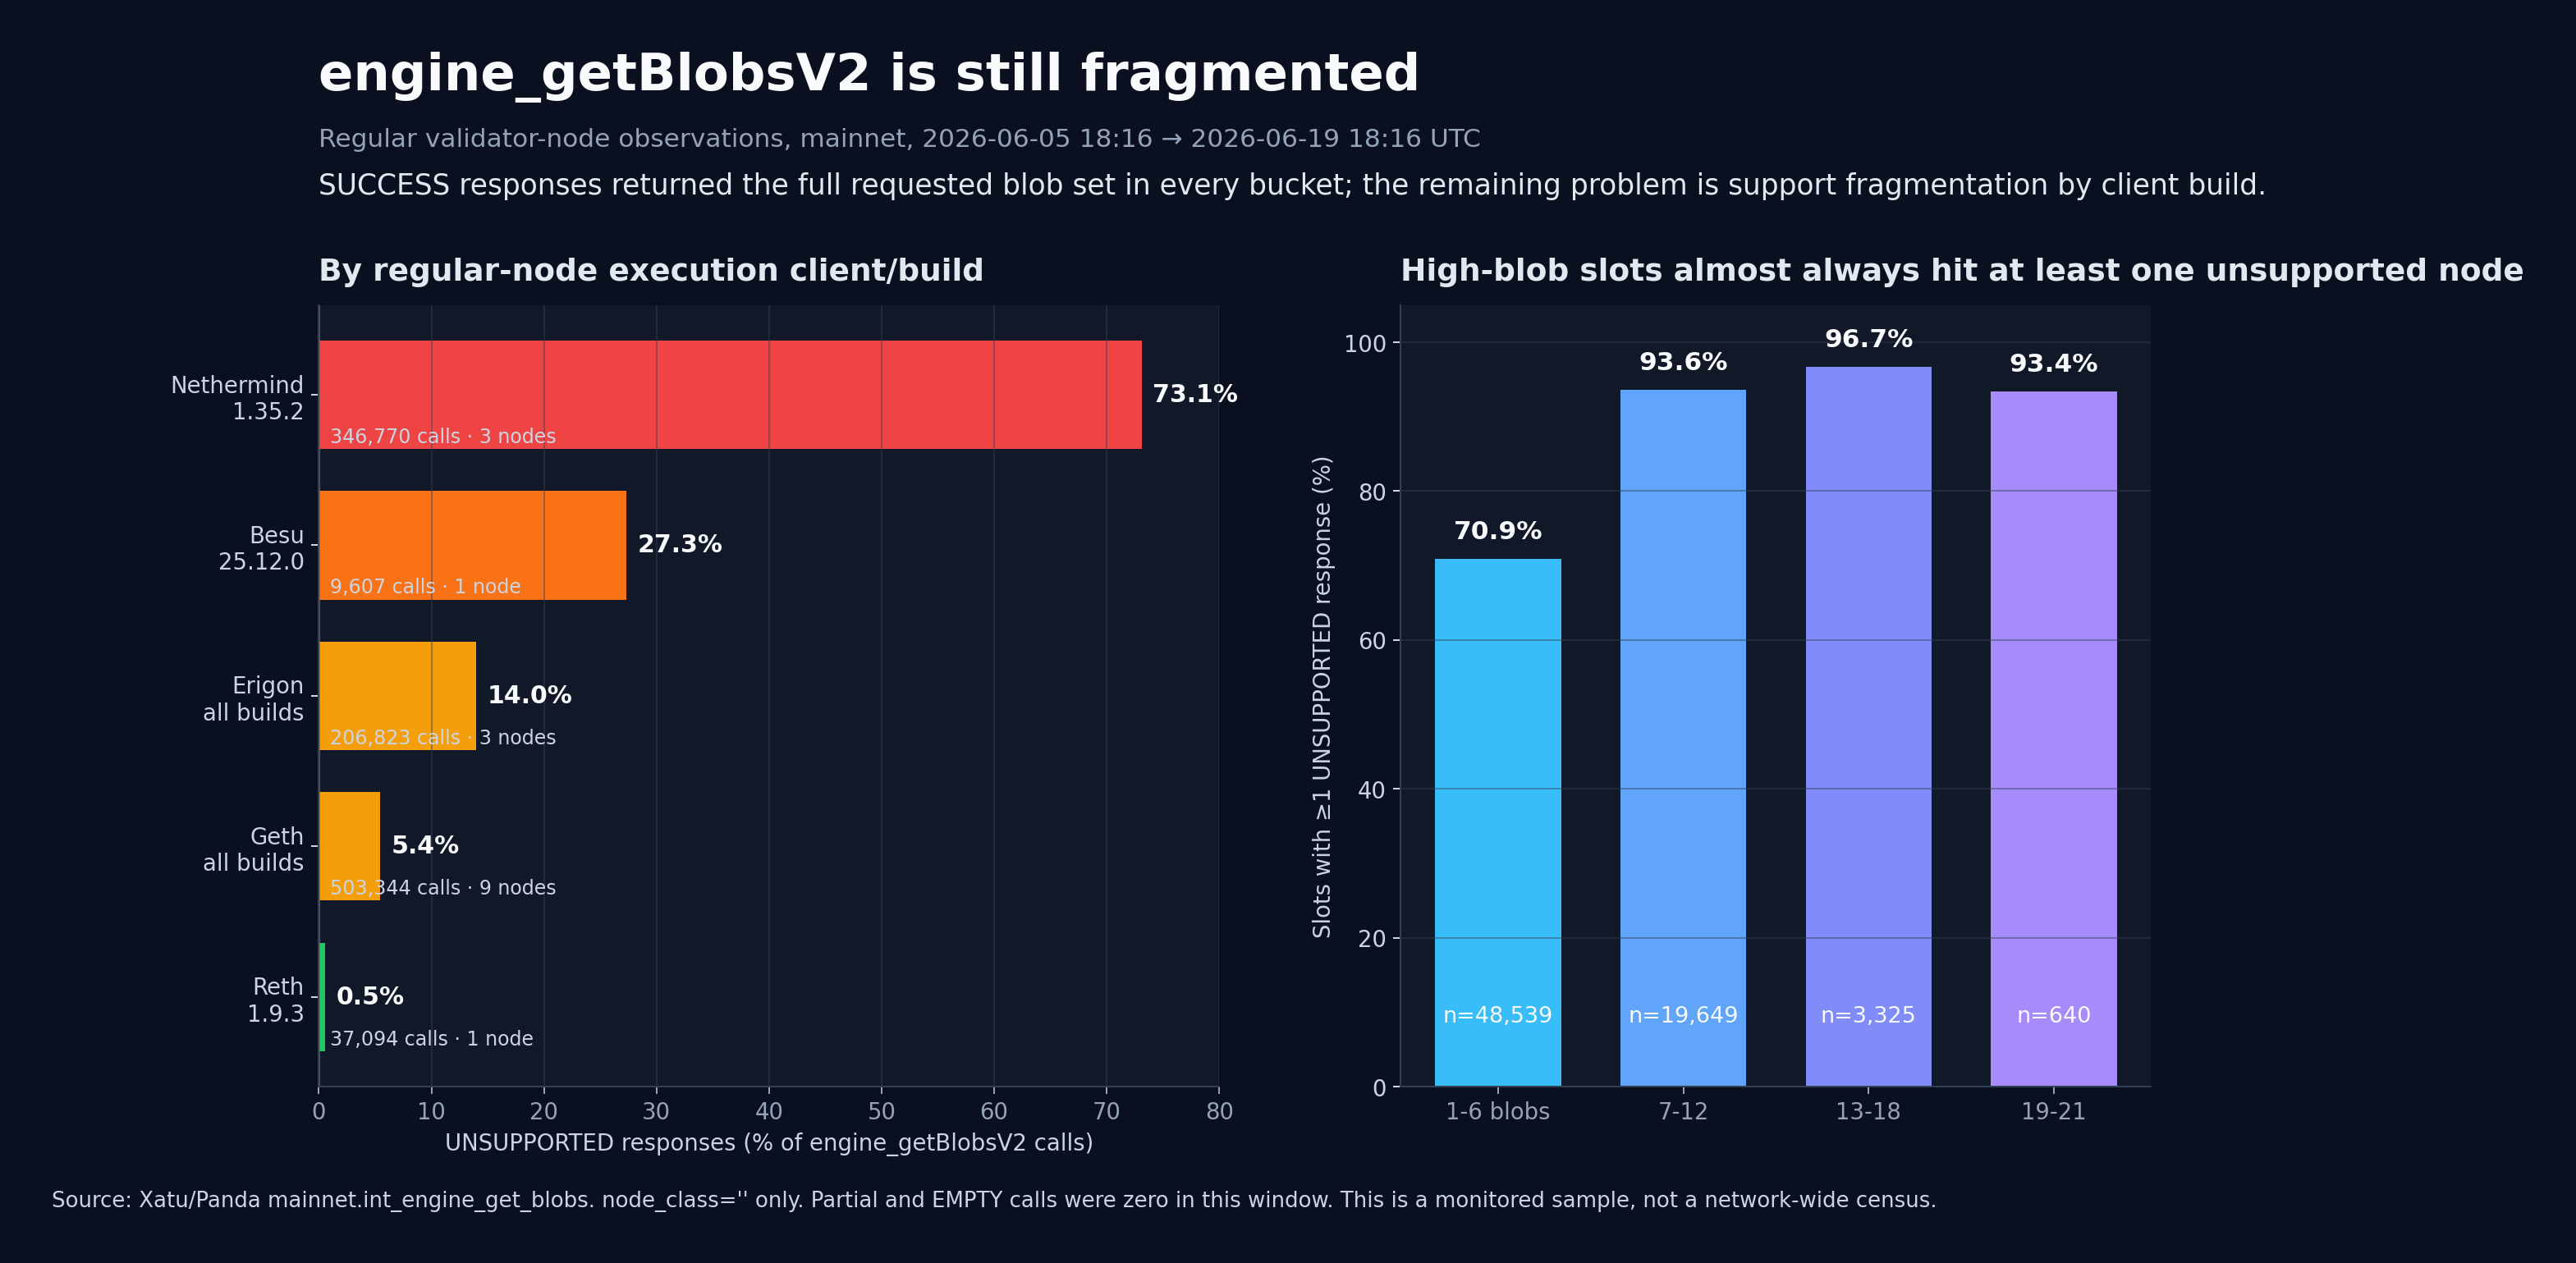
And when a client did answer SUCCESS, it returned the full requested blob set 100% of the time, including the 19-21 blob blocks.
That is the weird bit. This is not a chart about blobs going missing. It is a chart about some execution-client builds still not speaking the API path cleanly while other builds handle the same payloads just fine.
Here is the first cut of the query:
SELECT
  meta_execution_implementation AS client,
  meta_execution_version AS version,
  count() AS calls,
  uniqExact(meta_client_name) AS nodes,
  countIf(status = 'SUCCESS') AS success_calls,
  countIf(status = 'UNSUPPORTED') AS unsupported_calls,
  round(100.0 * countIf(status = 'UNSUPPORTED') / count(), 2) AS unsupported_pct,
  round(100.0 * countIf(status = 'SUCCESS') / count(), 2) AS success_pct,
  quantileExactIf(0.95)(duration_ms, status = 'SUCCESS') AS success_p95_ms
FROM mainnet.int_engine_get_blobs FINAL
WHERE slot_start_date_time >= now() - INTERVAL 14 DAY
  AND node_class = ''
  AND method_version = 'V2'
GROUP BY client, version
HAVING calls >= 500
ORDER BY unsupported_pct DESC, calls DESC;
The worst regular-node row is still the old Nethermind build:
- Nethermind
1.35.2+faa9b9e6: 73.09% unsupported across 346,770 calls from 3 monitored nodes - Besu
25.12.0-05b6c1a8: 27.34% unsupported across 9,607 calls from 1 monitored node - Erigon aggregate: 13.98% unsupported across 206,823 calls from 3 monitored nodes
- Geth aggregate: 5.43% unsupported across 503,344 calls from 9 monitored nodes
- Reth
1.9.3-27a8c0f5: 0.53% unsupported across 37,094 calls from 1 monitored node
The Geth and Erigon aggregate rows hide some messy build-level behavior. One short-lived Geth unstable build returned UNSUPPORTED for every observed call. Another Geth unstable build was at 67.71%. Erigon 3.3.0-a0c55b44 was at 35.89%.
So the old mental model, "this is a Nethermind lagging-upgrade problem," is too clean now. Nethermind is still the biggest offender in this sample, but it is not alone.
The second query checks whether fat blob blocks are actually failing to return complete payloads:
SELECT
  multiIf(
    requested_count <= 6, '01-06',
    requested_count <= 12, '07-12',
    requested_count <= 18, '13-18',
    '19-21'
  ) AS blob_bucket,
  countIf(status = 'SUCCESS') AS success_calls,
  countIf(status = 'SUCCESS' AND returned_count = requested_count) AS full_success_calls,
  round(
    100.0 * countIf(status = 'SUCCESS' AND returned_count = requested_count)
    / countIf(status = 'SUCCESS'),
    3
  ) AS full_success_pct,
  countIf(status = 'SUCCESS' AND returned_count != requested_count) AS not_full_success_calls
FROM mainnet.int_engine_get_blobs FINAL
WHERE slot_start_date_time >= now() - INTERVAL 14 DAY
  AND node_class = ''
  AND method_version = 'V2'
GROUP BY blob_bucket
ORDER BY blob_bucket;
That came back boring in the good way:
| Requested blobs | Successful calls | Full returns |
|---|---|---|
| 1-6 | 545,764 | 100.000% |
| 7-12 | 204,976 | 100.000% |
| 13-18 | 33,774 | 100.000% |
| 19-21 | 6,584 | 100.000% |
The 21-blob case is not quietly degrading into partial returns. If the call succeeds, it succeeds cleanly.
The annoying part is how often high-blob slots touch at least one unsupported node in the sample:
WITH per_slot AS (
  SELECT
    slot,
    max(requested_count) AS requested_count,
    countIf(status = 'SUCCESS') AS success_calls,
    countIf(status = 'UNSUPPORTED') AS unsupported_calls,
    uniqExactIf(meta_client_name, status = 'SUCCESS') AS success_nodes,
    uniqExactIf(meta_client_name, status = 'UNSUPPORTED') AS unsupported_nodes
  FROM mainnet.int_engine_get_blobs FINAL
  WHERE slot_start_date_time >= now() - INTERVAL 14 DAY
    AND node_class = ''
    AND method_version = 'V2'
  GROUP BY slot
)
SELECT
  multiIf(
    requested_count <= 6, '01-06',
    requested_count <= 12, '07-12',
    requested_count <= 18, '13-18',
    '19-21'
  ) AS blob_bucket,
  count() AS slots,
  countIf(unsupported_calls > 0) AS slots_with_unsupported,
  round(100.0 * countIf(unsupported_calls > 0) / count(), 1) AS pct_slots_with_unsupported,
  countIf(unsupported_calls > 0 AND success_calls = 0) AS unsupported_only_slots,
  round(avg(unsupported_nodes), 2) AS avg_unsupported_nodes,
  round(avg(success_nodes), 2) AS avg_success_nodes
FROM per_slot
GROUP BY blob_bucket
ORDER BY blob_bucket;
For 19-21 blob slots, 598 of 640 had at least one unsupported regular-node response. Only 2 were unsupported-only in this monitored sample. The average high-blob slot still had 10.41 successful regular nodes observing it.
That is a very specific failure shape.
Not "the network cannot fetch 21 blobs."
More like: "the happy path exists, but a real slice of clients is still on a side path where the Engine API says no."
A caveat before over-reading it: this is a monitored sample, not a census of the Ethereum network. The node counts in the table are small. Do not use these percentages as client market share, and do not use them to dunk on an entire client family. The useful thing here is the shape of the responses: SUCCESS is complete, UNSUPPORTED is clustered by build, and the two coexist on the same high-blob mainnet slots.
That matters because June finally gave mainnet enough fat blob blocks to stop guessing. The PeerDAS side handled them better than I expected. The Engine API support story is messier.
The blobs are boring now.
The client/version matrix is not.