The four-byte table keeps the loudest selector

canonical_execution_four_byte_counts sounds like the table you reach for when you want to count function calls. That is exactly how to get lied to.
I expected a selector leaderboard. What I found was one row per transaction, with the noisiest selector inside that transaction winning the row. Useful, but only if you do not read the name too literally.
The first smell was boring in the best possible way: row count equalled transaction count. Across the seven complete UTC days from June 22 through June 28, the table had 7,978,105 rows and 7,978,105 distinct transaction hashes. No transaction had more than one row.
That is not what a full call-selector table should look like. A single Ethereum transaction can call a router, delegate through a module, staticcall a pile of contracts, and transfer a token at the end. If the table held every selector seen inside execution, plenty of transactions would have more than one row.
Here is the sanity check that broke the simple interpretation:
WITH bounds AS (
  SELECT
    min(block_number) AS min_bn,
    max(block_number) AS max_bn
  FROM default.canonical_execution_block
  WHERE meta_network_name = 'mainnet'
    AND block_date_time >= toDateTime('2026-06-22 00:00:00')
    AND block_date_time <  toDateTime('2026-06-29 00:00:00')
),
per_tx AS (
  SELECT
    transaction_hash,
    count() AS rows_per_tx,
    sum(count) AS recorded_count
  FROM default.canonical_execution_four_byte_counts
  WHERE meta_network_name = 'mainnet'
    AND block_number BETWEEN (SELECT min_bn FROM bounds) AND (SELECT max_bn FROM bounds)
  GROUP BY transaction_hash
)
SELECT
  count() AS txs_with_fourbyte_rows,
  max(rows_per_tx) AS max_rows_per_tx,
  countIf(rows_per_tx > 1) AS txs_with_more_than_one_row,
  quantile(0.5)(recorded_count) AS p50_recorded_count,
  quantile(0.99)(recorded_count) AS p99_recorded_count,
  max(recorded_count) AS max_recorded_count
FROM per_tx;
| txs with rows | max rows per tx | txs with more than one row | p50 recorded count | p99 recorded count | max recorded count |
|---|---|---|---|---|---|
| 7,978,105 | 1 | 0 | 1 | 8 | 2,942 |
The count column is still real. It is just not a top-level transaction count, and it is not a complete list of every selector in the transaction. The loudest example I found was this transaction:
0xfb788a64000618ea6fafcc602b53426f239f3b9042a4ba6c7b55664d1cc29049
The four-byte table stored one row for it:
| signature | size | count |
|---|---|---|
0xe1dc0761 | 32 | 2,942 |
Then I checked the raw traces for the same transaction. The stored selector was there, and the count matched exactly, but it was not alone.
SELECT
  substring(action_input, 1, 10) AS selector,
  action_call_type,
  count() AS trace_rows,
  uniqExact(action_to) AS called_addresses
FROM default.canonical_execution_traces
WHERE meta_network_name = 'mainnet'
  AND block_number = 25387079
  AND transaction_hash = '0xfb788a64000618ea6fafcc602b53426f239f3b9042a4ba6c7b55664d1cc29049'
  AND action_input IS NOT NULL
  AND length(action_input) >= 10
GROUP BY selector, action_call_type
ORDER BY trace_rows DESC;
| selector | call type | trace rows | called addresses |
|---|---|---|---|
0xe1dc0761 | static_call | 2,942 | 1 |
0x4b6d7b73 | static_call | 1,192 | 1 |
0x6352211e | static_call | 1,192 | 1 |
0x31465641 | static_call | 900 | 1 |
0xaeaf8b55 | call | 1 | 1 |
0xa9059cbb | call | 1 | 1 |
So the table did not invent the count. It kept the biggest selector bucket and dropped the other selector buckets from that transaction. That is a very different surface from "all function calls."
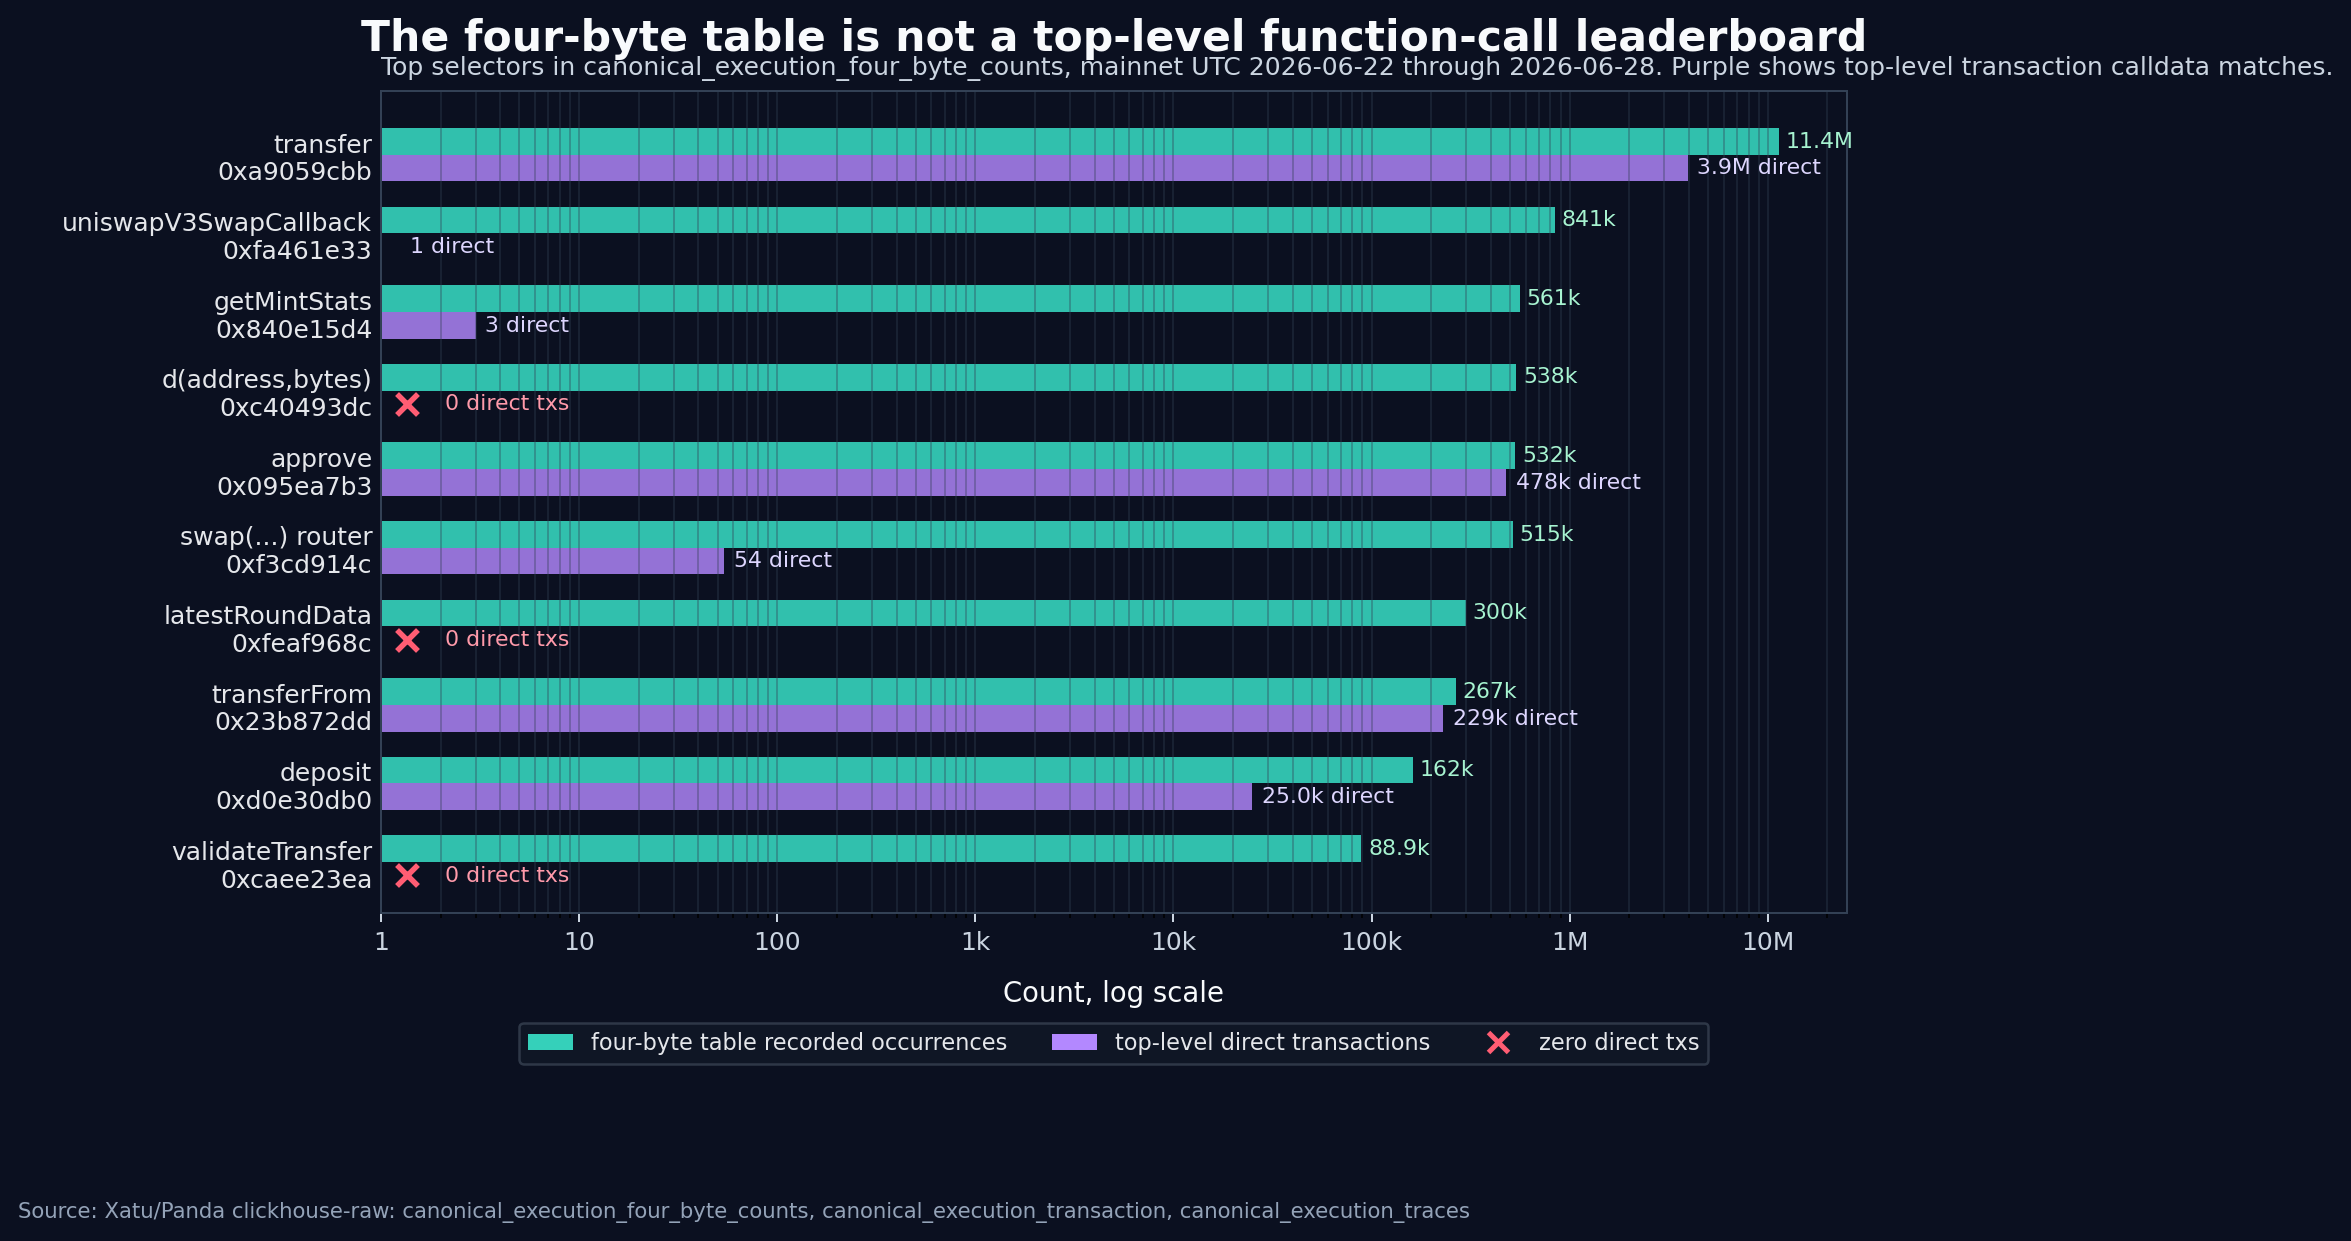
The top-selector leaderboard makes the trap obvious. I grouped canonical_execution_four_byte_counts by selector, then cross-checked two separate surfaces: top-level transaction calldata from canonical_execution_transaction, and trace-level calldata from canonical_execution_traces.
WITH bounds AS (
  SELECT
    min(block_number) AS min_bn,
    max(block_number) AS max_bn
  FROM default.canonical_execution_block
  WHERE meta_network_name = 'mainnet'
    AND block_date_time >= toDateTime('2026-06-22 00:00:00')
    AND block_date_time <  toDateTime('2026-06-29 00:00:00')
),
fb AS (
  SELECT
    signature,
    sum(count) AS fourbyte_recorded_occurrences,
    count() AS fourbyte_rows,
    uniqExact(transaction_hash) AS fourbyte_txs
  FROM default.canonical_execution_four_byte_counts
  WHERE meta_network_name = 'mainnet'
    AND block_number BETWEEN (SELECT min_bn FROM bounds) AND (SELECT max_bn FROM bounds)
  GROUP BY signature
),
tx AS (
  SELECT
    substring(input, 1, 10) AS signature,
    count() AS direct_top_level_txs
  FROM default.canonical_execution_transaction
  WHERE meta_network_name = 'mainnet'
    AND block_number BETWEEN (SELECT min_bn FROM bounds) AND (SELECT max_bn FROM bounds)
    AND n_input_bytes >= 4
  GROUP BY signature
),
tr AS (
  SELECT
    substring(action_input, 1, 10) AS signature,
    count() AS trace_rows,
    uniqExact(transaction_hash) AS trace_txs,
    countIf(action_call_type = 'static_call') AS static_calls,
    countIf(action_call_type = 'delegate_call') AS delegate_calls,
    countIf(action_call_type = 'call') AS calls,
    uniqExact(action_to) AS action_to_addresses
  FROM default.canonical_execution_traces
  WHERE meta_network_name = 'mainnet'
    AND block_number BETWEEN (SELECT min_bn FROM bounds) AND (SELECT max_bn FROM bounds)
    AND action_input IS NOT NULL
    AND length(action_input) >= 10
  GROUP BY signature
)
SELECT
  fb.signature,
  fourbyte_recorded_occurrences,
  fourbyte_rows,
  fourbyte_txs,
  ifNull(direct_top_level_txs, 0) AS direct_top_level_txs,
  ifNull(trace_rows, 0) AS trace_rows,
  ifNull(trace_txs, 0) AS trace_txs,
  ifNull(static_calls, 0) AS static_calls,
  ifNull(delegate_calls, 0) AS delegate_calls,
  ifNull(calls, 0) AS calls,
  ifNull(action_to_addresses, 0) AS action_to_addresses
FROM fb
LEFT JOIN tx USING signature
LEFT JOIN tr USING signature
ORDER BY fourbyte_recorded_occurrences DESC
LIMIT 18;
A few rows are normal enough. ERC-20 transfer(address,uint256) is huge everywhere: 11.37M recorded four-byte occurrences, 3.94M direct top-level transactions, and 18.99M trace rows. approve(address,uint256) and transferFrom(address,address,uint256) also look like things you would expect in an Ethereum selector chart.
Then the chart starts doing the weird thing. 0xc40493dc had 538,346 recorded occurrences in the four-byte table, across only 3,101 transactions, and zero top-level transactions whose calldata started with that selector. The trace table cross-check counted 538,346 trace rows for the same selector, so the count is real. It is just buried inside execution.
latestRoundData() is the more familiar version of the same mistake. It had 300,351 recorded occurrences and zero direct top-level transactions. The trace table saw 308,222 rows for that selector, mostly static_call, across 685 called addresses. That is oracle plumbing, not users directly sending latestRoundData() transactions.
The selector names in the chart are only labels. The hard identifier is the 4-byte hex, because selector collisions and contract-specific ABIs are always lurking. I used names for the obvious/common selectors and left the uglier ones ugly on purpose.
The practical read is simple: do not sort canonical_execution_four_byte_counts and call it "most called functions." Use it as a hint for the selector that dominated a transaction. If you want top-level user entrypoints, use canonical_execution_transaction and substring(input, 1, 10). If you want internal call surface, use canonical_execution_traces and group by substring(action_input, 1, 10) with call type and called address beside it.
The four-byte table is still useful. It just is not the table its name makes you want it to be.