The data-column availability table is mostly gossip

mainnet.fct_data_column_availability_by_slot looks like the table you would use to ask whether PeerDAS custody probes are succeeding. It has availability_pct, success_count, missing_count, failure_count, and a column called probe_count. I used it that way first, and it told me something too clean: 100.00% availability for seven complete UTC days.
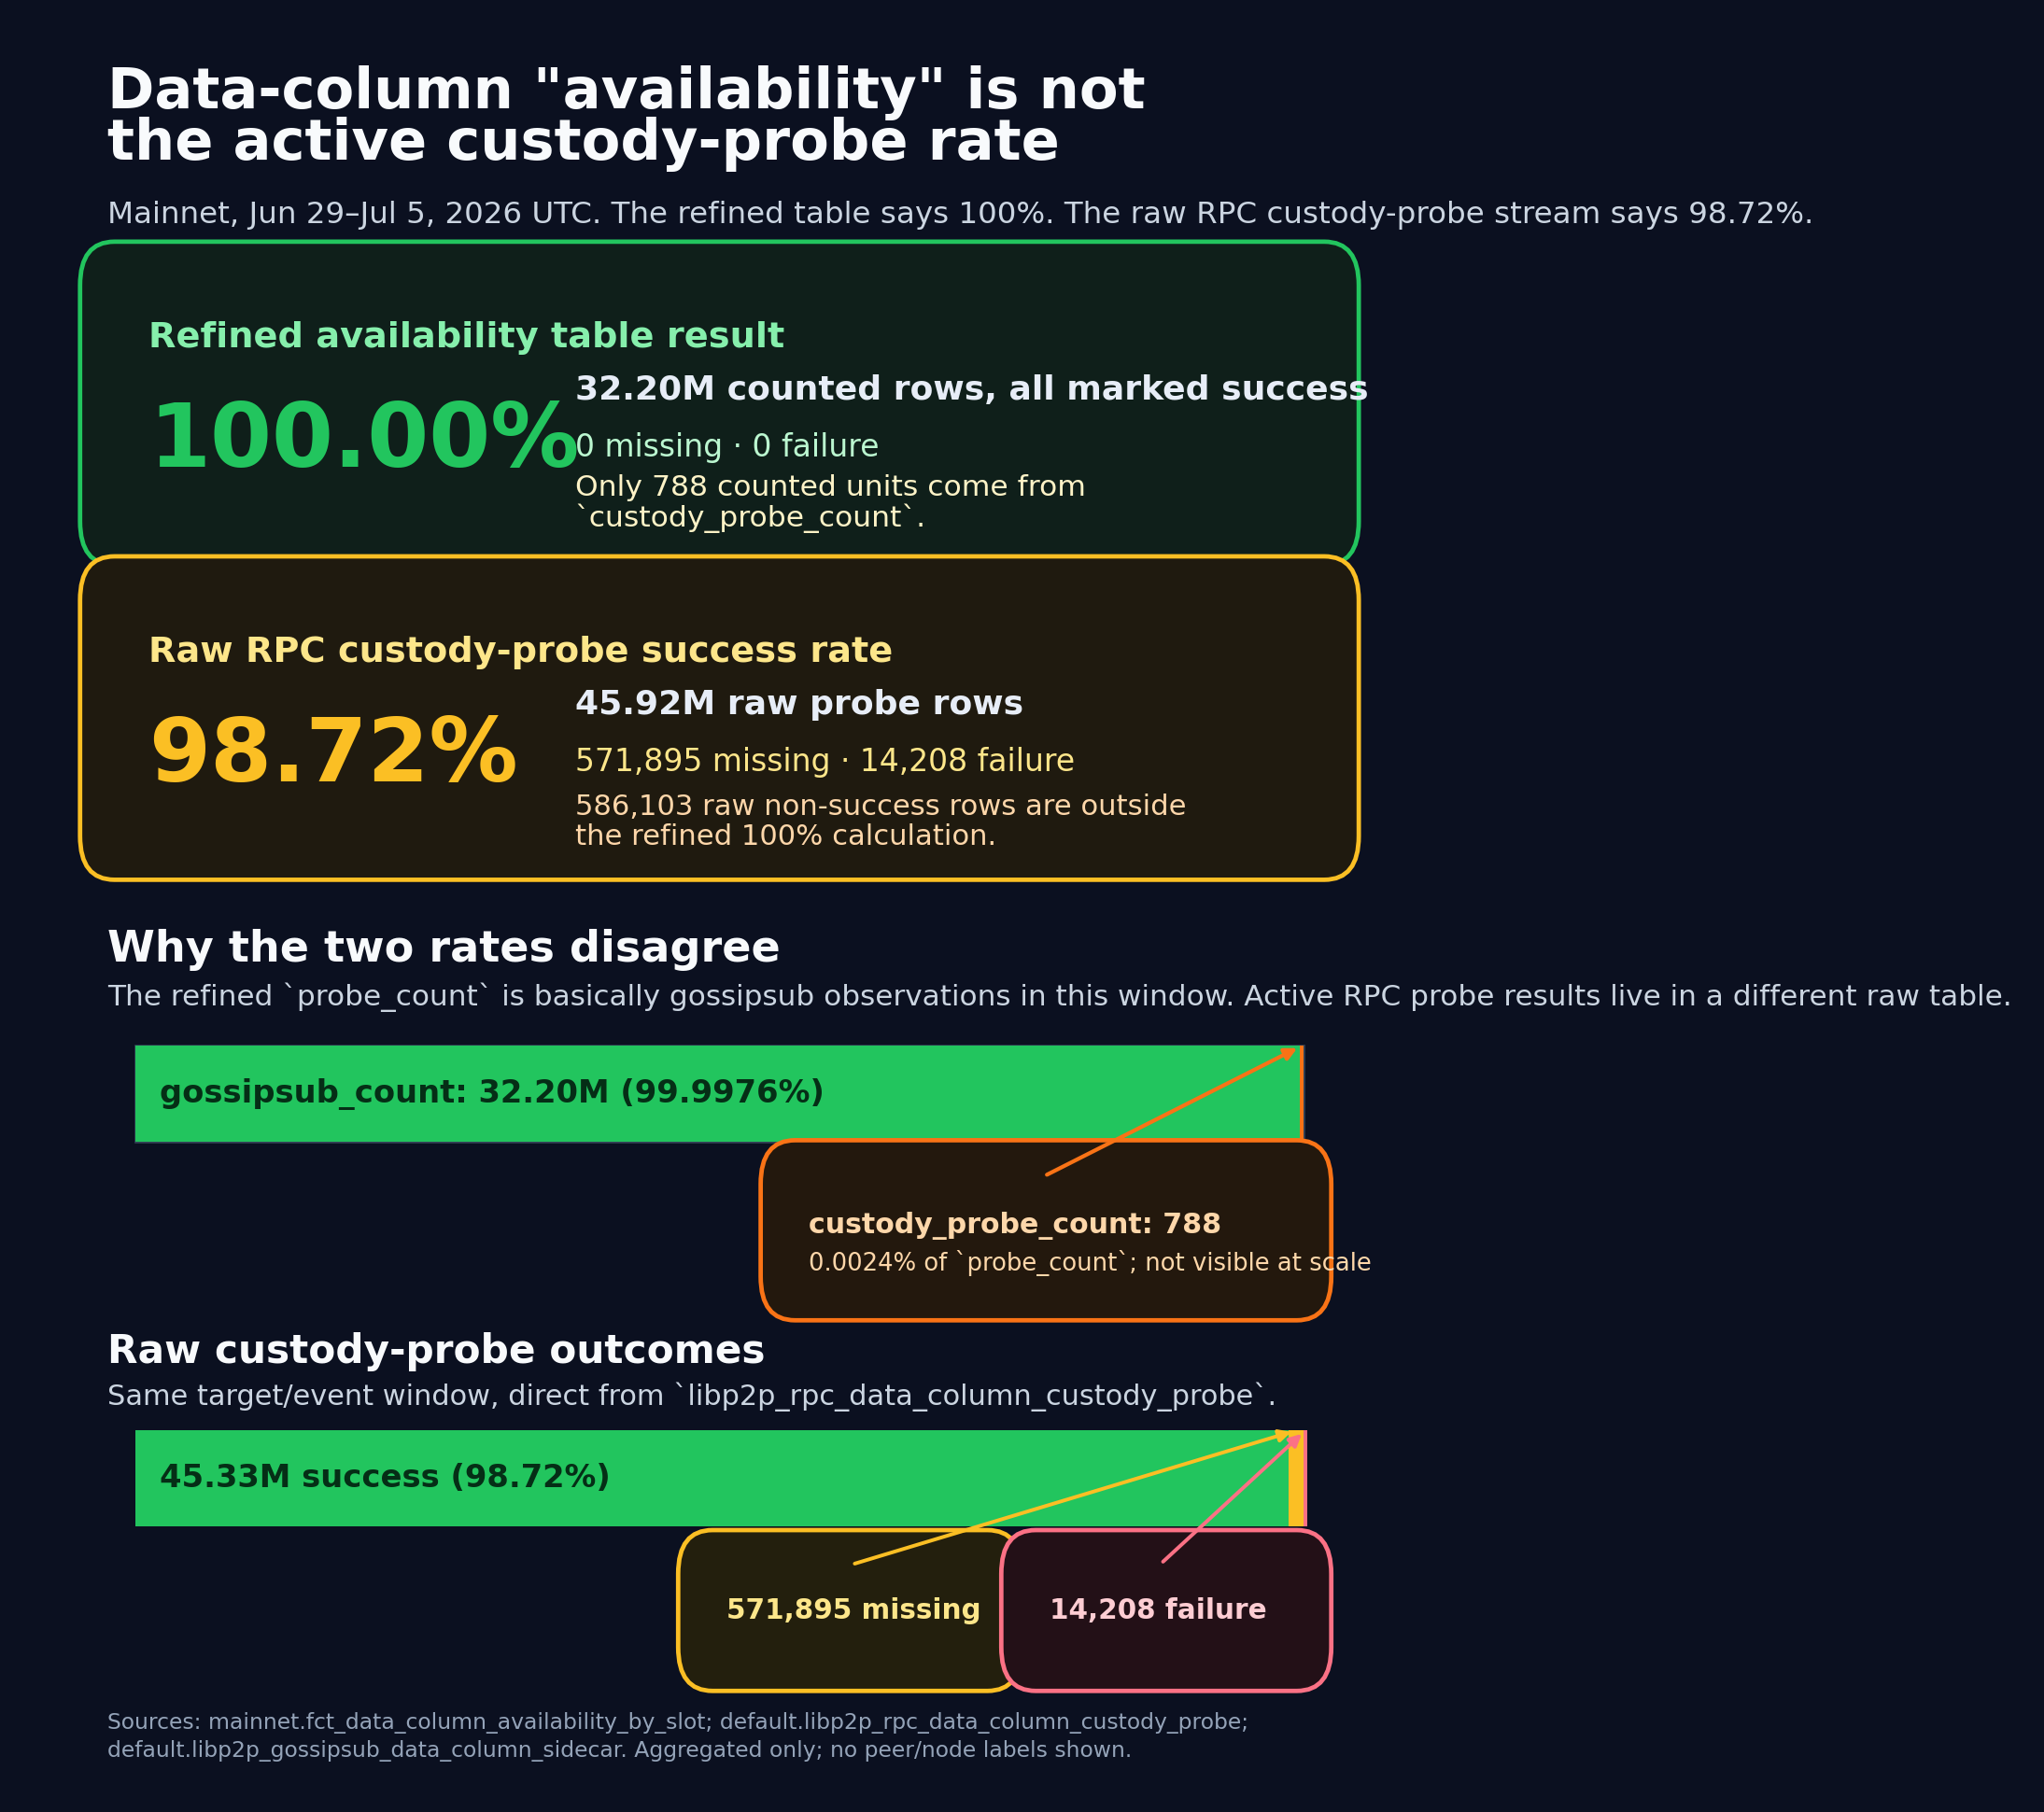
That is not the active custody-probe success rate. It is mostly the gossipsub sidecar observation stream wearing an availability-shaped name.
Here is the first query. I kept the row grain at slot/column because that is what the table promises: data-column availability by slot and column. The week was Jun 29 through Jul 5 UTC, the latest complete seven-day window available when I ran this.
SELECT
  count() AS availability_rows,
  uniqExact(slot) AS slots,
  uniqExact(column_index) AS columns,
  countIf(availability_pct < 100) AS rows_below_100,
  sum(probe_count) AS total_probe_count,
  sum(success_count) AS total_success_count,
  sum(failure_count) AS total_failure_count,
  sum(missing_count) AS total_missing_count,
  sum(custody_probe_count) AS custody_probe_count,
  sum(gossipsub_count) AS gossipsub_count
FROM mainnet.fct_data_column_availability_by_slot
WHERE slot_start_date_time >= toDateTime('2026-06-29 00:00:00')
  AND slot_start_date_time <  toDateTime('2026-07-06 00:00:00')
SETTINGS force_primary_key = 0;
That returned 4,734,767 slot/column rows across 36,988 blob-carrying slots and all 128 columns. Every single row had availability_pct = 100. Summed up, the table had 32,204,322 probe_count units, 32,204,322 successes, and exactly zero missing or failure units.
The catch is the source split. Of those 32.20M counted units, 32,203,534 were gossipsub_count. Only 788 were custody_probe_count. That is 0.0024% of the denominator. If you read probe_count as active RPC custody probes, the query looks like a perfect week. If you read the split columns, it is saying something narrower: the refined table was almost entirely built from observed gossipsub data-column sidecars in this window.
I checked the slot denominator because a surprising number is usually a window bug before it is a finding. mainnet.fct_block_blob_count FINAL had 36,935 canonical blob slots and 53 orphaned blob slots in the same week. That sums to the same 36,988 slots the availability table saw. So the refined table was covering the expected blob-slot surface; it just was not carrying the active probe failures into the availability calculation.
The raw custody-probe table tells the other half. For a fair bounded comparison, I required both the probe event time and the target slot time to fall inside the same week. That avoids mixing in probes of older target slots, which this table also contains.
SELECT
  count() AS raw_custody_rows,
  uniqExact(slot) AS target_slots,
  uniqExact(column_index) AS columns,
  countIf(result = 'success') AS success_rows,
  countIf(result = 'missing') AS missing_rows,
  countIf(result = 'failure') AS failure_rows,
  round(100 * countIf(result = 'success') / count(), 3) AS success_pct,
  quantileExact(0.5)(response_time_ms) AS p50_ms,
  quantileExact(0.95)(response_time_ms) AS p95_ms
FROM default.libp2p_rpc_data_column_custody_probe
WHERE meta_network_name = 'mainnet'
  AND event_date_time >= toDateTime('2026-06-29 00:00:00')
  AND event_date_time <  toDateTime('2026-07-06 00:00:00')
  AND slot_start_date_time >= toDateTime('2026-06-29 00:00:00')
  AND slot_start_date_time <  toDateTime('2026-07-06 00:00:00');
That returned 45,920,295 raw RPC custody-probe rows over 36,953 target slots and all 128 columns. The success rate was 98.724%: 45,334,192 success, 571,895 missing, and 14,208 failure. The median successful response was 202 ms, and p95 was 916 ms.
Those missing rows do not mean "Ethereum data availability was 1.276% broken." A raw custody probe is an instrumented request to a peer in the Xatu sample. A missing result means that peer did not serve that requested column when asked. It is a useful peer-surface signal, not a chain-wide data-loss counter. But it is absolutely not zero, and it is not represented in the refined table's 100% calculation above.
The gossipsub cross-check lines up with that reading. Over the same target/event window, the raw default.libp2p_gossipsub_data_column_sidecar table had 32,269,208 rows and 4,734,336 distinct (slot, block_root, column_index) keys. That sits right next to the refined table's 32,203,534 gossipsub_count and 4,734,767 slot/column rows. The exact edges differ a little, but the order of magnitude is not subtle.
SELECT
  count() AS raw_gossip_rows,
  uniqExact(tuple(slot, beacon_block_root, column_index)) AS column_keys,
  uniqExact(message_id) AS message_ids
FROM default.libp2p_gossipsub_data_column_sidecar
WHERE meta_network_name = 'mainnet'
  AND event_date_time >= toDateTime('2026-06-29 00:00:00')
  AND event_date_time <  toDateTime('2026-07-06 00:00:00')
  AND slot_start_date_time >= toDateTime('2026-06-29 00:00:00')
  AND slot_start_date_time <  toDateTime('2026-07-06 00:00:00');
So the safe interpretation is boring but important. fct_data_column_availability_by_slot is fine for questions about the observed data-column sidecar surface, especially if you split gossipsub_count from custody_probe_count. It is the wrong shortcut for "what fraction of active RPC custody probes succeeded?" For that, start with libp2p_rpc_data_column_custody_probe, keep the target-slot window explicit, and say plainly that the denominator is probe rows from an instrumented sample.
The table did not show a perfect active probe week. It showed a perfect gossipsub-observation denominator.