The Gas Limit Doubled in 2025: How Validators Quietly Resized Ethereum
Ethereum's block gas limit doubled in 2025. Not through a hard fork. Not through a governance vote. Through three coordinated waves of validators updating their configuration files.
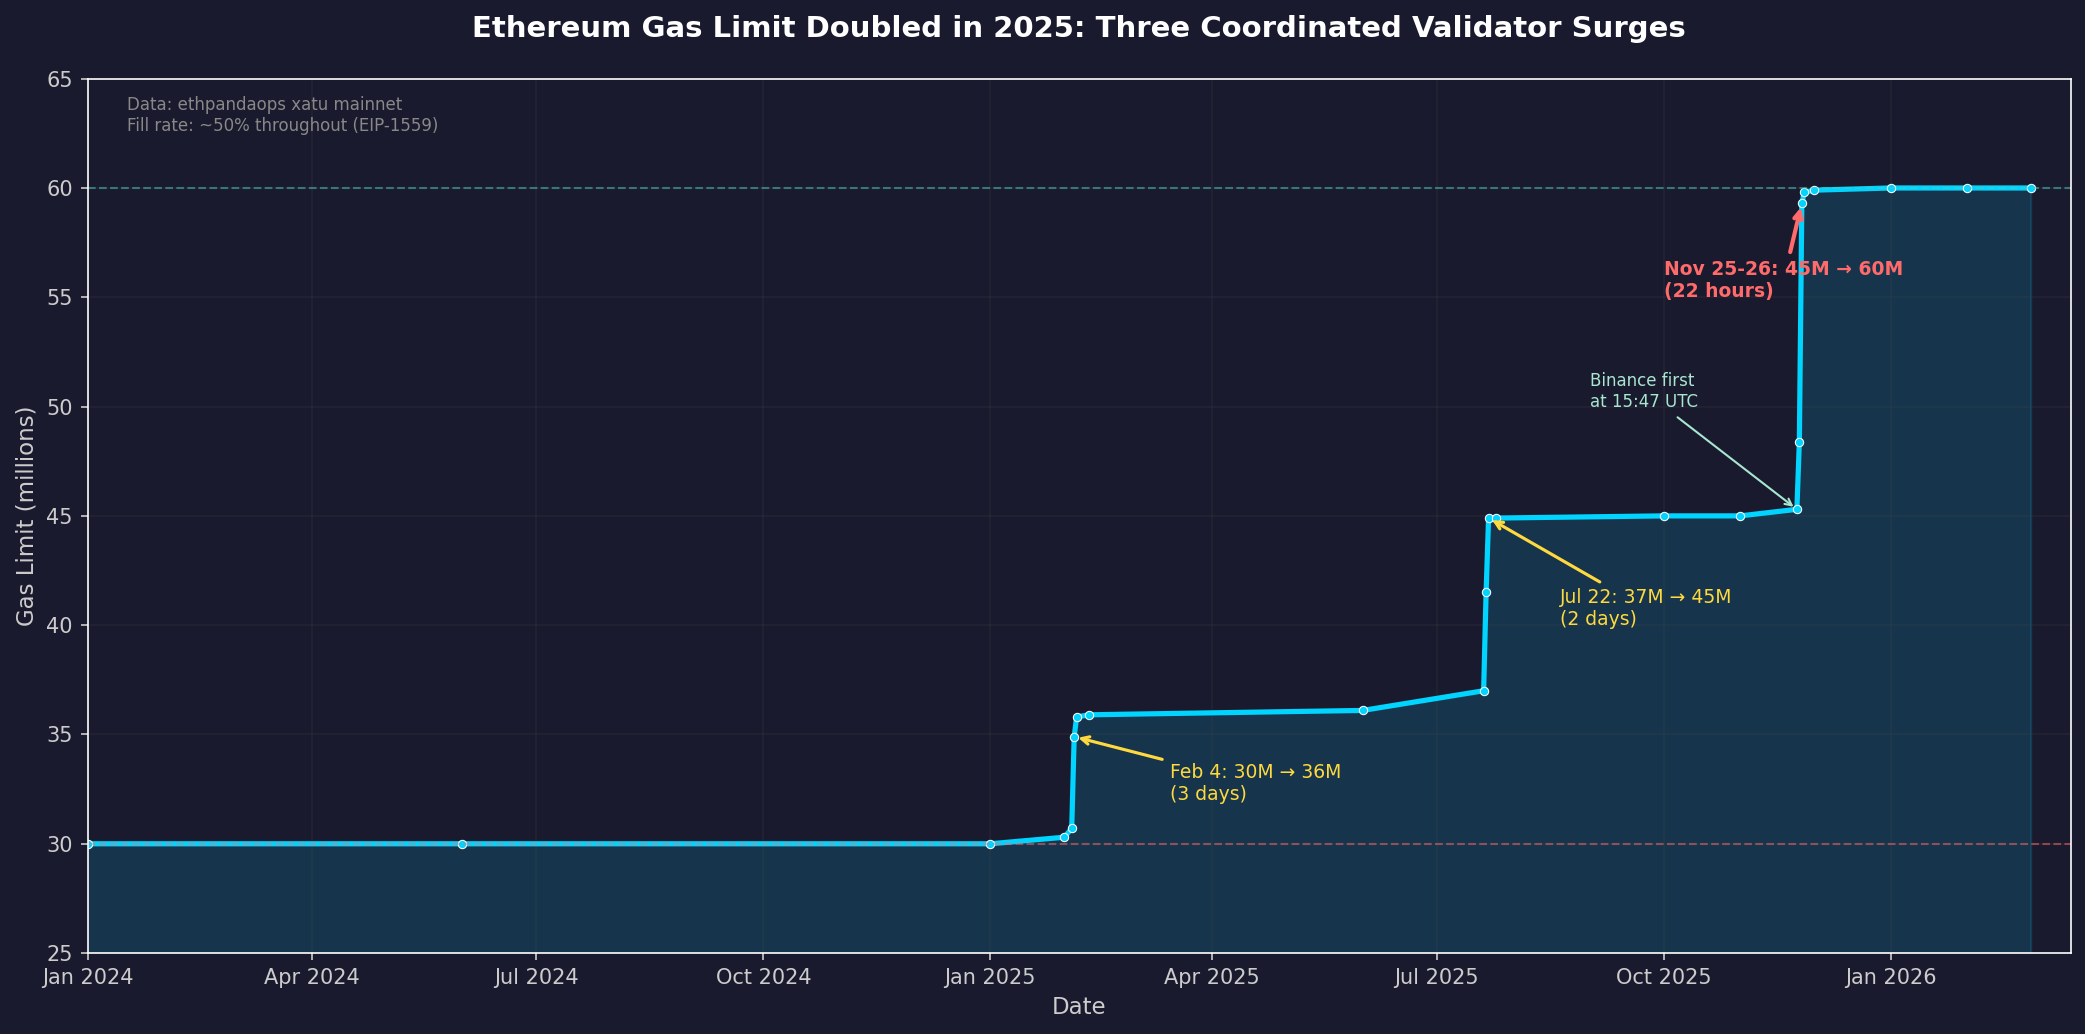
The limit went from 30 million to 60 million gas—a 100% increase in block capacity—between February and November 2025. Each wave moved faster than the last. The final surge, from 45M to 60M, took just 22 hours.
Correction, 2026-06-22: the historical block-header series in this post is still right, but the final section over-read
fct_execution_gas_limit_signalling_dailyas live validator preference. That table reflects relay-registration cache data, and some old 30M/36M entries are stale signatures, not current block-production signals. I wrote up the correction here: The 36M gas limit signals are fossils.
What actually happened
The gas limit is set by validators. Each block proposer signals their preferred limit in the block header. The actual limit drifts toward the median preference, moving at most 1/1024 of the current value per block.
This mechanism allows gradual changes without protocol upgrades. But what we saw in 2025 was not gradual.
Wave 1: February 4-6, 2025
For over a year, the limit held steady at 30M. Then on February 4, it jumped to 34.9M. By February 6, it stabilized at 36M. A 20% increase in 48 hours.
-- Source: xatu canonical_beacon_block
SELECT
    toDate(slot_start_date_time) as day,
    round(avg(execution_payload_gas_limit) / 1e6, 2) as avg_gas_M
FROM canonical_beacon_block
WHERE slot_start_date_time BETWEEN '2025-02-01' AND '2025-02-10'
GROUP BY day ORDER BY day
| Day | Avg Gas Limit |
|---|---|
| Feb 1 | 30.2M |
| Feb 2 | 30.3M |
| Feb 3 | 30.7M |
| Feb 4 | 34.9M |
| Feb 5 | 35.8M |
| Feb 6 | 35.9M |
Wave 2: July 21-22, 2025
After months at 36M, the limit jumped again. From 37M to 44.9M in two days. This was a 25% increase.
Wave 3: November 24-26, 2025
The big one. The limit went from 45M to 60M—a 33% increase—in just 22 hours.
The first block to push above 46M was at slot 13097935, proposed by Binance at 15:47:23 UTC on November 24. Within hours, Lido, Coinbase, Bitfinex, and solo stakers joined. By November 26 at 02:00 UTC, the network had converged on 60M.
-- First blocks above 46M, with proposer entities
SELECT
    slot,
    execution_payload_gas_limit / 1e6 as gas_M,
    entity
FROM canonical_beacon_block b
JOIN mainnet.fct_block_proposer_entity e ON b.slot = e.slot
WHERE slot_start_date_time BETWEEN '2025-11-24 12:00:00' AND '2025-11-24 20:00:00'
  AND execution_payload_gas_limit > 46000000
ORDER BY slot
LIMIT 10
| Slot | Gas Limit | Entity |
|---|---|---|
| 13097935 | 46.02M | Binance |
| 13097967 | 46.02M | (unknown) |
| 13097971 | 46.02M | piertwo |
| 13097972 | 46.07M | Lido |
| 13097973 | 46.11M | Bitfinex |
| 13097974 | 46.16M | Coinbase |
| 13097975 | 46.20M | Binance |
| 13097976 | 46.16M | solo_stakers |
The 50% rule
Here's the counterintuitive part: despite doubling the gas limit, blocks are not "more full." The fill rate stayed almost exactly at 50% throughout.
-- Gas used vs limit over time
SELECT
    day_start_date,
    round(avg_gas_limit / 1e6, 1) as limit_M,
    round(avg_gas_used / 1e6, 1) as used_M,
    round(avg_gas_used * 100.0 / avg_gas_limit, 1) as fill_pct
FROM mainnet.fct_execution_gas_limit_daily gl
JOIN mainnet.fct_execution_gas_used_daily gu USING (day_start_date)
WHERE day_start_date >= '2025-11-01'
| Period | Limit | Used | Fill |
|---|---|---|---|
| Nov 1-24 (45M) | 45.0M | 22.7M | 50.5% |
| Nov 25 (transition) | 48.4M | 24.5M | 50.6% |
| Nov 26 (60M) | 59.3M | 30.1M | 50.7% |
| Dec-Feb (60M) | 60.0M | 30.4M | 50.8% |
This is EIP-1559 working as designed. The base fee adjusts to maintain equilibrium at 50% utilization. When the limit goes up, the base fee drops, demand increases, and blocks fill back to the target.
But here's what actually changed: absolute throughput doubled. At 30M limit, blocks used ~15M gas. At 60M limit, blocks use ~30M gas. The network processes twice as many transactions per block, at lower base fees.
| Date | Base Fee |
|---|---|
| Jan 2025 | 16.5 gwei |
| Feb 2025 (post-36M) | 1.5 gwei |
| Nov 2025 (pre-60M) | 0.08 gwei |
| Jan 2026 | 0.05 gwei |
The invisible governance
What makes this remarkable is how it happened. There was no on-chain vote. No core dev announcement. No DAO proposal.
Validators simply updated their --gas-limit flags (or equivalent configuration). When enough did so simultaneously, the network followed.
The acceleration is striking:
- Feb 4-6: 3 days for 30M → 36M
- Jul 21-22: 2 days for 37M → 45M
- Nov 25-26: 22 hours for 45M → 60M
Each wave was faster, suggesting validators learned from the previous rounds. The coordination mechanism is informal—Twitter discussions, Discord channels, staking provider internal decisions—but the effect is binding.
This is governance without governance. A $300 billion network changed its most critical economic parameter three times in one year, and the only record is in the block headers.
What the data shows
The CBT table fct_execution_gas_limit_signalling_daily reveals current validator preferences. While 60M is now the overwhelming majority (~860K observations/day), a persistent minority signals 36M (~66K/day) and a handful signal 100-120M (~500-600/day).
-- Current signalling distribution (Feb 27, 2026)
SELECT
    day_start_date,
    gas_limit_band_counts
FROM mainnet.fct_execution_gas_limit_signalling_daily
WHERE day_start_date = '2026-02-27'
Key bands:
- 60M: 859,780 (99.5% of monitoring observations)
- 36M: 65,752 (7.6%)
- 30M: 15,019 (1.7%)
- 100M: 505 (0.06%)
- 120M: 415 (0.05%)
The 36M faction represents validators who either never updated from the pre-November configuration or are actively pushing to reduce the limit. The 100-120M signals are validators testing or advocating for further increases.
Why this matters
Ethereum's gas limit is its most important economic parameter. It determines:
- How many transactions fit in a block
- How much state growth occurs
- What hardware is required to run a node
- Who can afford to participate
The fact that this can change by 100% in 22 hours, without any protocol upgrade, reveals both the flexibility and the fragility of the system.
On one hand, Ethereum can adapt quickly to demand. When L2s need more blob space, when DeFi activity surges, the network can respond.
On the other hand, a coordinated action by major staking providers (Lido, Coinbase, Binance) could theoretically move the limit to any value within days. There are no hard bounds—only the soft constraint of social consensus.
The data shows this is not theoretical. It happened three times in 2025. And it will happen again.
Chart: Daily average gas limit from January 2024 through February 2026, showing the three transition events. Data source: ethpandaops xatu mainnet.