Prysm waited a full slot before the fast fallback

A Prysm node fell 17 slots behind. Its recovery path then spent about 12 seconds waiting for each old slot before making a direct data-column fetch that usually finished in 1.3 seconds. On a 12-second chain, that turns catch-up into a treadmill.
This happened on Platåberget after two Prysm + Nethermind nodes resumed from an execution-layer redeploy on August 29. The nodes were importing old Gloas blocks, but Prysm still took the live-gossip path for each payload envelope. Gossip for those slots had ended minutes earlier.
Prysm PR #17429 opened at 22:12 UTC with a fix and a short incident table. I pulled the same public node logs through Panda rather than carrying that table forward. The PR remained open at commit 426d102c46dfc3de7f4c6735207611bc04771975 when I cut this post.
One dead slot, then the real fetch
I froze a 20-minute window from 21:27 through 21:47 UTC. That is 100 physical 12-second slots. The query fetched only the four Prysm nodes and six exact log shapes; the parsing happened locally so the ANSI-decorated Prysm messages stayed inspectable.
from ethpandaops import clickhouse
import pandas as pd
import re

logs = clickhouse.query("clickhouse-raw", r"""
SELECT
  Timestamp,
  ResourceAttributes['host.name'] AS host,
  Body
FROM external.otel_logs
WHERE toDate(Timestamp) = toDate('2026-08-29')
  AND Timestamp >= toDateTime64('2026-08-29 21:20:00', 3, 'UTC')
  AND Timestamp <  toDateTime64('2026-08-29 22:00:00', 3, 'UTC')
  AND IngressUser = 'glamsterdam-devnet-8'
  AND ResourceAttributes['host.name'] IN (
    'prysm-geth-1', 'prysm-besu-1',
    'prysm-nethermind-1', 'prysm-nethermind-2'
  )
  AND (
    Body ILIKE '%Could not process pending payload envelope%'
    OR Body ILIKE '%Processed pending block and cleared it in cache%'
    OR Body ILIKE '%Requested direct data column sidecars from peers%'
    OR Body ILIKE '%Synced execution payload envelope%'
    OR Body ILIKE '%Synced new block%'
    OR Body ILIKE '%headSlot%'
  )
ORDER BY host, Timestamp
""")

ansi = re.compile(r'\x1b\[[0-9;]*m')
logs['clean'] = logs.Body.map(lambda s: ansi.sub('', s))
logs['Timestamp'] = pd.to_datetime(logs.Timestamp, utc=True)
logs = logs.drop_duplicates(['Timestamp', 'host', 'Body'])
logs = logs[
    (logs.Timestamp >= '2026-08-29 21:27:00+00:00') &
    (logs.Timestamp <  '2026-08-29 21:47:00+00:00')
]

logs['root'] = (
    logs.clean.str.extract(r'BlockRoot: (0x[0-9a-f]{64})')[0]
    .fillna(logs.clean.str.extract(r'root=(0x[0-9a-f]{64})')[0])
)
logs['duration_ms'] = pd.to_numeric(
    logs.clean.str.extract(r'duration=([0-9.]+)')[0]
) * logs.clean.str.extract(r'duration=[0-9.]+(ms|s)')[0].map(
    {'ms': 1.0, 's': 1000.0}
)
The two healthy controls each logged 100 unique Synced new block slots and no payload-envelope availability failures. The lagging nodes logged 79 and 87 unique block imports. That count is processing telemetry, not canonical progress; a node can import its own current-slot orphan while its head is still old.
The failure pipeline is cleaner. Nethermind-1 produced 71 unique data availability check failed roots. Nethermind-2 produced 77. Every one of those 148 roots matched both a Processed pending block row and the later direct-fetch row, with no duplicate (Timestamp, host, Body) records in the 2,410-row transport.
- On Nethermind-1, the median pending-block duration was 12.083 seconds. The median direct fetch was 1.356 seconds.
- On Nethermind-2, the same medians were 12.099 seconds and 1.308 seconds.
- All 148 direct fetches started with
initialMissingCount=128and completed with no columns missing.
The slow part was not fetching 128 columns. The slow part was waiting one full slot before trying.
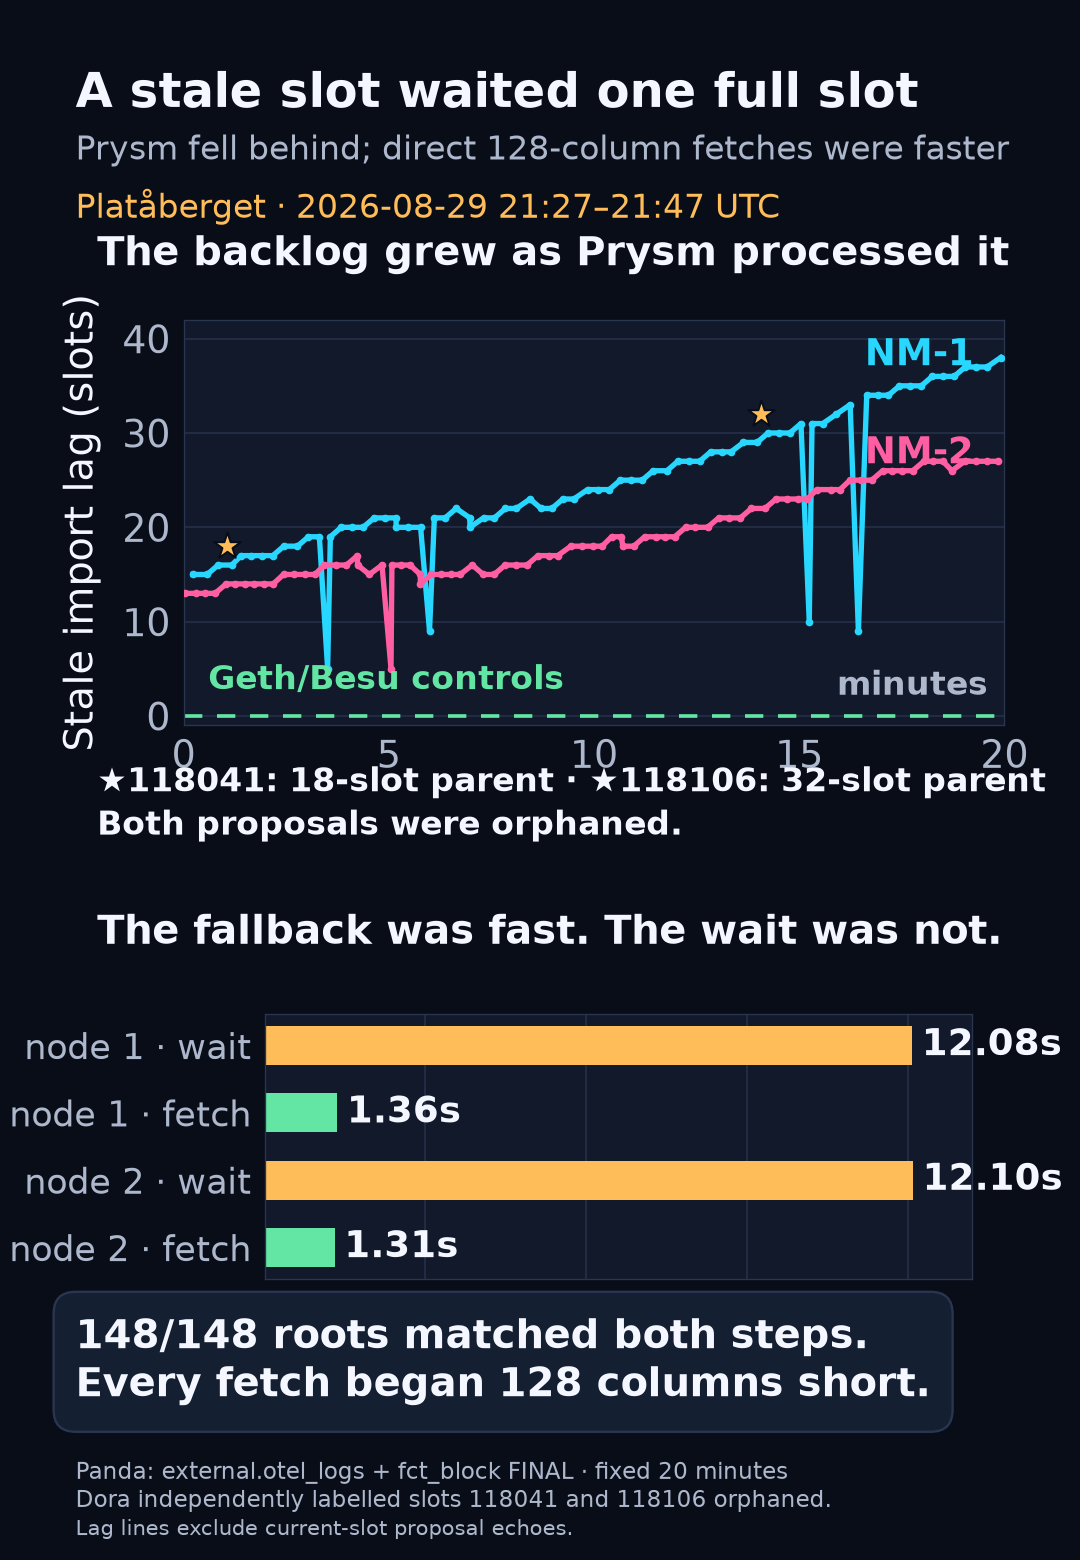
The lag lines use only stale imports, defined as at least two slots behind the wall clock. I excluded current-slot proposal echoes because importing a block does not make it the node's head. The exact proposal-preparation logs give the harder check: node 1 prepared slot 118041 from head slot 118023, then prepared slot 118106 from head slot 118074.
Why the wait could never help
The old Prysm branch chose between a blocking gossip wait and an immediate storage check with inRegularSync(). These nodes still counted as regularly synced even though their heads were well behind. Prysm therefore waited on the sidecar notifier until the payload-envelope context expired after one slot, then the pending queue fetched all 128 columns directly.
PR #17429 changes the gate to slot + 1 >= currentSlot. Current and immediately previous slots can still wait for in-flight gossip; older slots fail fast and move to the direct path. It also drains pending Gloas columns before processing the matching payload envelope. The telemetry cannot split those two fixes, and the PR notes separate retention limits that can still make a lagging node refetch every column.
The arithmetic here is ugly. Median wait plus median fetch was 13.439 seconds on node 1 and 13.407 seconds on node 2. The chain advanced every 12 seconds. The observed serial loop could work continuously and still lose ground.
That showed up at proposal time. I checked the two node-1 proposal blocks against the refined branch-status model:
SELECT
  slot,
  block_root,
  parent_root,
  proposer_index,
  status
FROM `glamsterdam-devnet-8`.fct_block FINAL
WHERE slot_start_date_time >= toDateTime('2026-08-29 21:20:00', 'UTC')
  AND slot_start_date_time <  toDateTime('2026-08-29 21:50:00', 'UTC')
  AND slot IN (118041, 118106)
ORDER BY slot, block_root;
Slot 118041 used the exact slot-118023 head root from the log and was orphaned. Slot 118106 was also orphaned after preparation from a head 32 slots old. Platåberget's public Dora independently shows both roots, statuses, and the prysm-nethermind-1 proposer labels.
This is pre-release Gloas software on one public devnet, not a Mainnet incident. The Geth and Besu pairings are workload controls, not evidence that Nethermind caused a Prysm bug; they did not share the same restart and backlog. The measured window also predates the open fix, so none of this says whether the patched path has recovered in a deployed image.
The columns were not slow. Prysm spent one slot hoping old gossip would arrive, then fetched the missing data in about a ninth of that time. That is exactly the wrong order when the chain is already running away from you.