One PeerDAS observer saw 278 MB per full slot

Arrival time has been my stand-in for PeerDAS bandwidth. It sort of worked, but it was still a timing proxy. A process-level counter now exposes bytes by port, so I expected a clean rising curve with blob count.
That curve exists. It is not remotely uniform.
Across 15 fixed mainnet observers from July 4 through July 17, the median observer's median consensus P2P receive traffic moved from 5.214 MB on zero-blob slots to 9.639 MB on 21-blob slots. One observer went from 29.856 MB to 277.879 MB. Same chain, same blob count, but a 1.85x middle-of-the-cohort change and a 9.31x outlier.
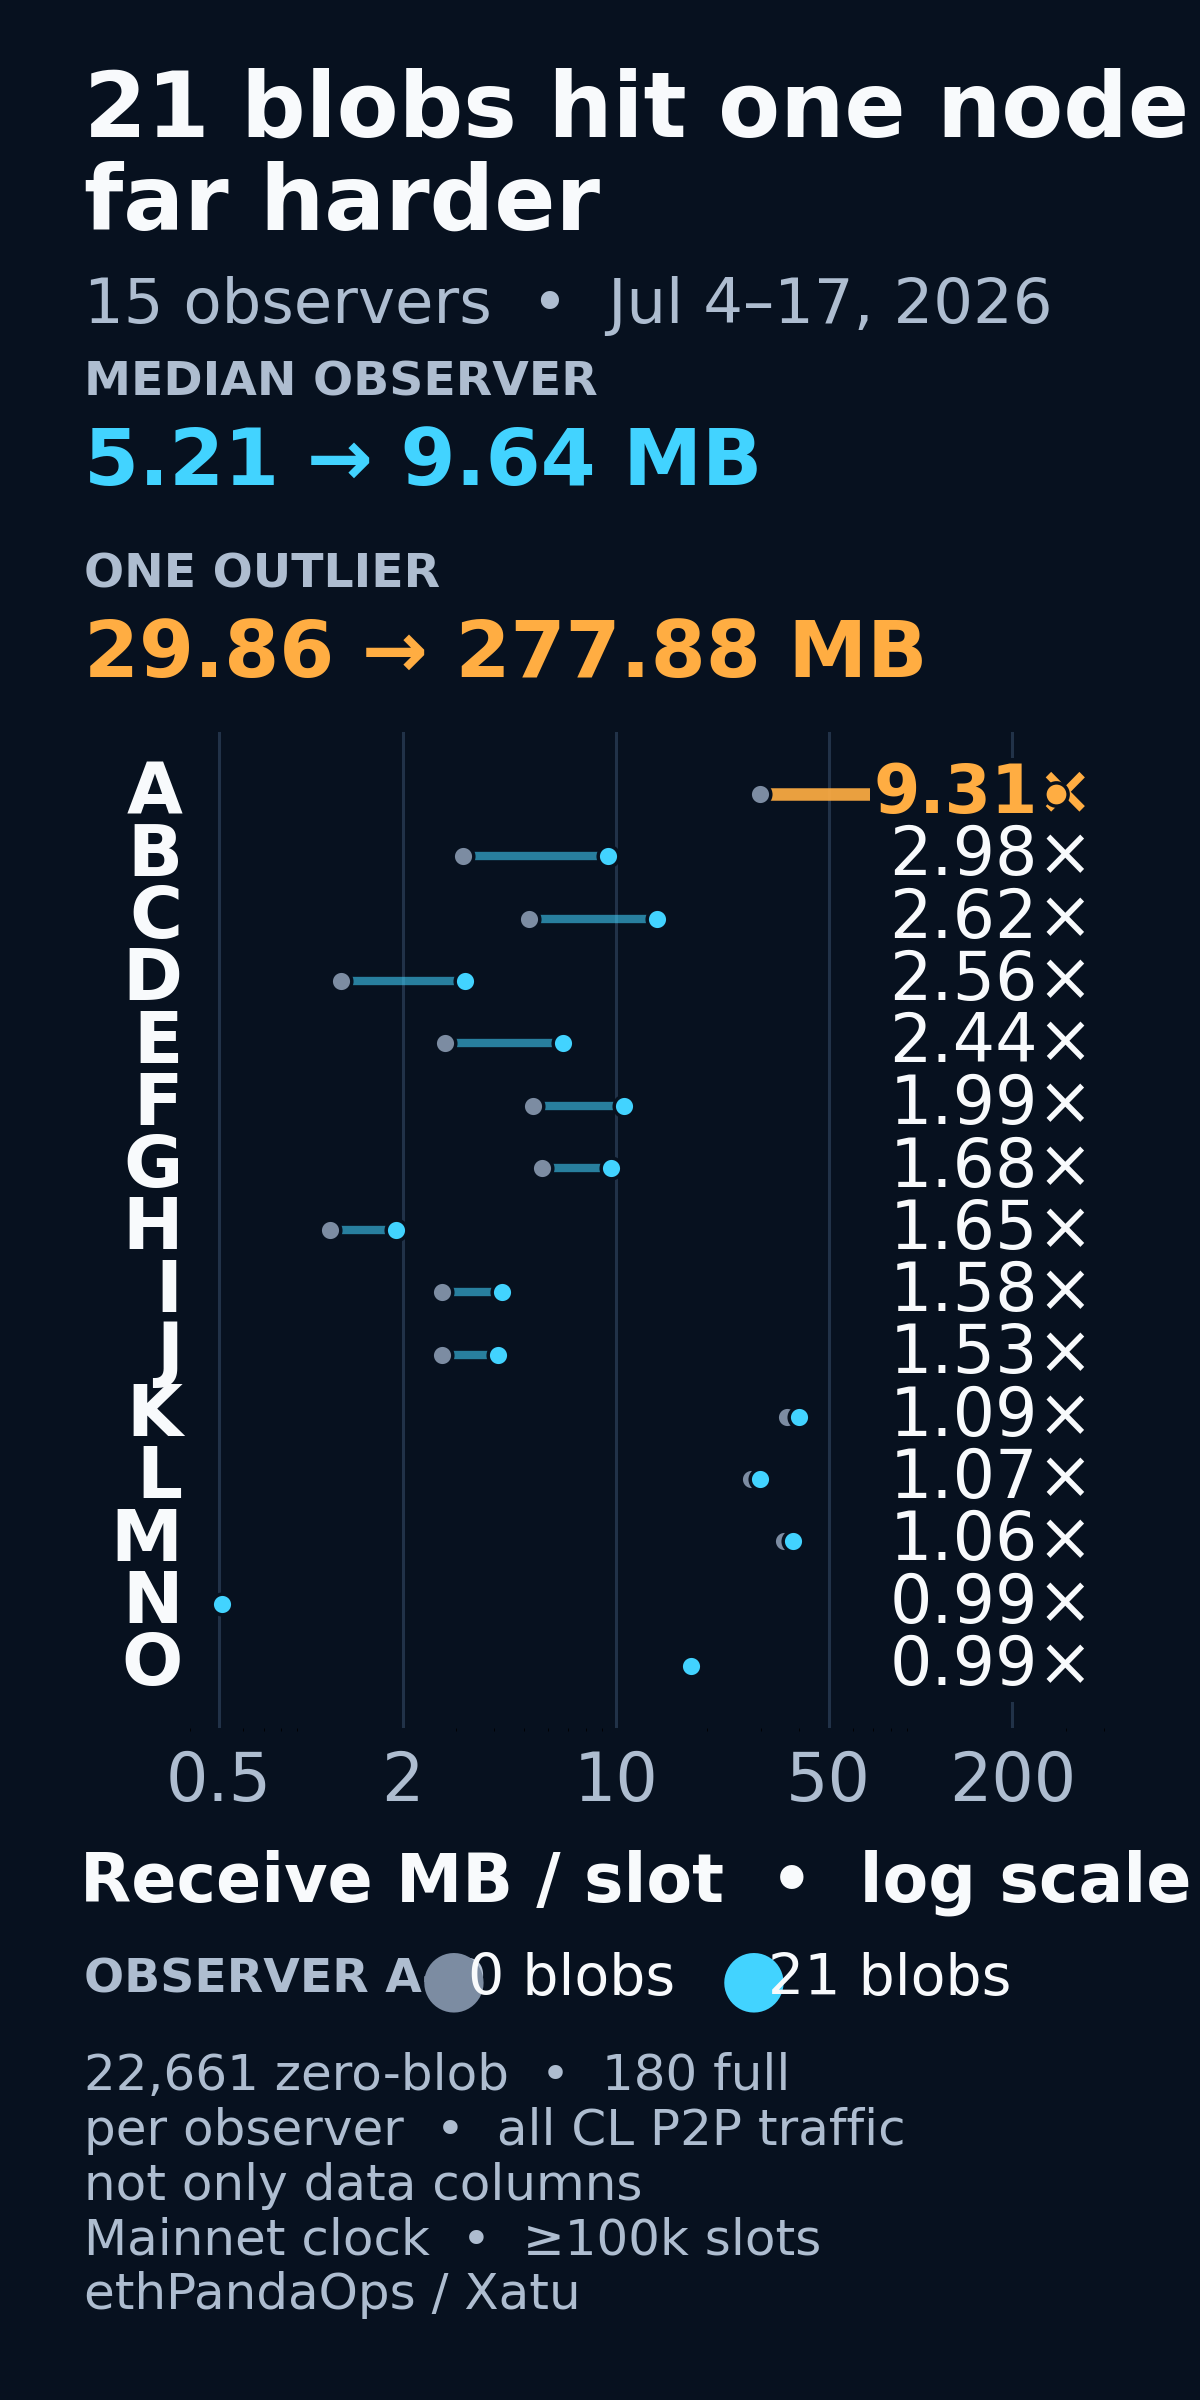
The source table is mainnet.fct_node_network_io_by_process. It stores sub-slot process counters split by port and direction. I summed the cl_p2p receive and transmit rows into one node-slot, then joined those slots to finalized canonical blocks.
The cohort gate mattered more than I expected. The table had 21 observer streams labelled mainnet, but five carried a constant non-mainnet wallclock offset and never lined up with canonical mainnet slots. One more stream covered only 2,404 matching slots. I required a mainnet wallclock and at least 100,000 of the 100,800 slots in the 14 complete days, which left 15 observers.
Here is the query that produced the chart. 131072 is GAS_PER_BLOB; dividing canonical execution_payload_blob_gas_used by it converts protocol blob gas into a blob count.
WITH
blocks AS (
  SELECT
    slot,
    toUInt32(ifNull(execution_payload_blob_gas_used, 0) / 131072) AS blob_count
  FROM mainnet.fct_block FINAL
  WHERE status = 'canonical'
    AND slot_start_date_time >= toDateTime('2026-07-04 00:00:00')
    AND slot_start_date_time <  toDateTime('2026-07-18 00:00:00')
),
io AS (
  SELECT
    wallclock_slot AS slot,
    meta_client_name,
    client_type,
    sumIf(toFloat64(io_bytes), direction = 'rx') AS rx_bytes,
    sumIf(toFloat64(io_bytes), direction = 'tx') AS tx_bytes
  FROM mainnet.fct_node_network_io_by_process FINAL
  WHERE wallclock_slot_start_date_time >= toDateTime('2026-07-04 00:00:00')
    AND wallclock_slot_start_date_time <  toDateTime('2026-07-18 00:00:00')
    AND meta_network_name = 'mainnet'
    AND port_label = 'cl_p2p'
    AND toInt64(wallclock_slot) = intDiv(
      dateDiff(
        'second',
        toDateTime('2020-12-01 12:00:23'),
        toDateTime(wallclock_slot_start_date_time)
      ),
      12
    )
  GROUP BY slot, meta_client_name, client_type
),
joined AS (
  SELECT *
  FROM io
  GLOBAL INNER JOIN blocks USING (slot)
),
stable AS (
  SELECT meta_client_name
  FROM joined
  GROUP BY meta_client_name
  HAVING uniqExact(slot) >= 100000
),
node_p50 AS (
  SELECT
    meta_client_name,
    any(client_type) AS process,
    quantileExactIf(0.5)(rx_bytes, blob_count = 0) AS zero_blob_rx_bytes,
    quantileExactIf(0.5)(rx_bytes, blob_count = 21) AS full_blob_rx_bytes
  FROM joined
  WHERE meta_client_name GLOBAL IN stable
  GROUP BY meta_client_name
)
SELECT
  cityHash64(meta_client_name) AS observer,
  process,
  zero_blob_rx_bytes / 1e6 AS zero_blob_rx_mb,
  full_blob_rx_bytes / 1e6 AS full_blob_rx_mb,
  full_blob_rx_bytes / zero_blob_rx_bytes AS ratio
FROM node_p50
ORDER BY ratio DESC
One ClickHouse detail is worth spelling out because it bit the first pass. GLOBAL ANY INNER JOIN returned one matching observer row per slot in this shape, which made the denominator look like slots rather than node-slots. The verified query uses GLOBAL INNER JOIN; every complete block then contributes 15 observer rows.
The outlier did most of the work in any simple average. The equal-node mean of the 15 per-node medians rose from 11.886 MB to 31.154 MB, a 2.62x jump. Remove the outlier and it moves from 10.602 MB to 13.531 MB, only 1.28x. That one observer supplied 85.8% of the summed increase across the 15 node medians.
This was not a clean client split either. Seven observers from the same process family ranged from 1.065x to 9.307x. Across the whole cohort, ten observers rose by more than 1.5x while five stayed within 10% of their zero-blob baseline. Whatever made the orange line weird was observer-specific enough that blaming an implementation would be lazy.
The direction split makes it stranger. The outlier's receive median rose 9.31x, but its transmit median moved from 52.155 MB to 82.495 MB, or 1.58x. The counter does not break bytes down by Gossipsub topic or remote peer, so I cannot separate custody subscriptions, peer topology, duplicate reception, or another local configuration choice. The data supports an ugly label: one monitored receive path expanded far more than the others.
I cross-checked the block denominator two ways. For every nonzero bucket from one through 21 blobs, gas-derived block counts matched mainnet.fct_block_blob_count FINAL exactly. The explicit table has no zero-blob rows, so the canonical block table supplied the 22,661 zero-blob slots; both paths returned 180 canonical 21-blob slots.
For a byte-scale check, I took those exact 180 canonical roots into raw libp2p_gossipsub_data_column_sidecar, reduced observer repetitions to one semantic row per (block_root, column_index), and summed the 128 columns. All 180 roots had all 128 columns. Their median one-copy message total was 5.577 MB.
SELECT
  slot,
  beacon_block_root,
  column_index,
  argMax(message_size, tuple(event_date_time, updated_date_time)) AS message_bytes
FROM default.libp2p_gossipsub_data_column_sidecar FINAL
WHERE meta_network_name = 'mainnet'
  AND beacon_block_root IN ({canonical_21_blob_roots:Array(String)})
GROUP BY slot, beacon_block_root, column_index
That 5.577 MB is not a prediction for a node's network counter. It is one parsed content copy across all columns. The process counter also includes peer fanout, duplicates, blocks, attestations, control traffic, and protocol overhead, so the outlier's 277.879 MB is not "50 copies" in any defensible sense. The comparison is only a physical sanity check: one content set was nowhere near 278 MB.
Blob count predicts more bytes. It did not predict what one node would eat. For capacity planning, the observer and configuration distribution was not a rounding error here; it was the story.