Ethereum state writes get multiplied by the trie
A state write is not one write.
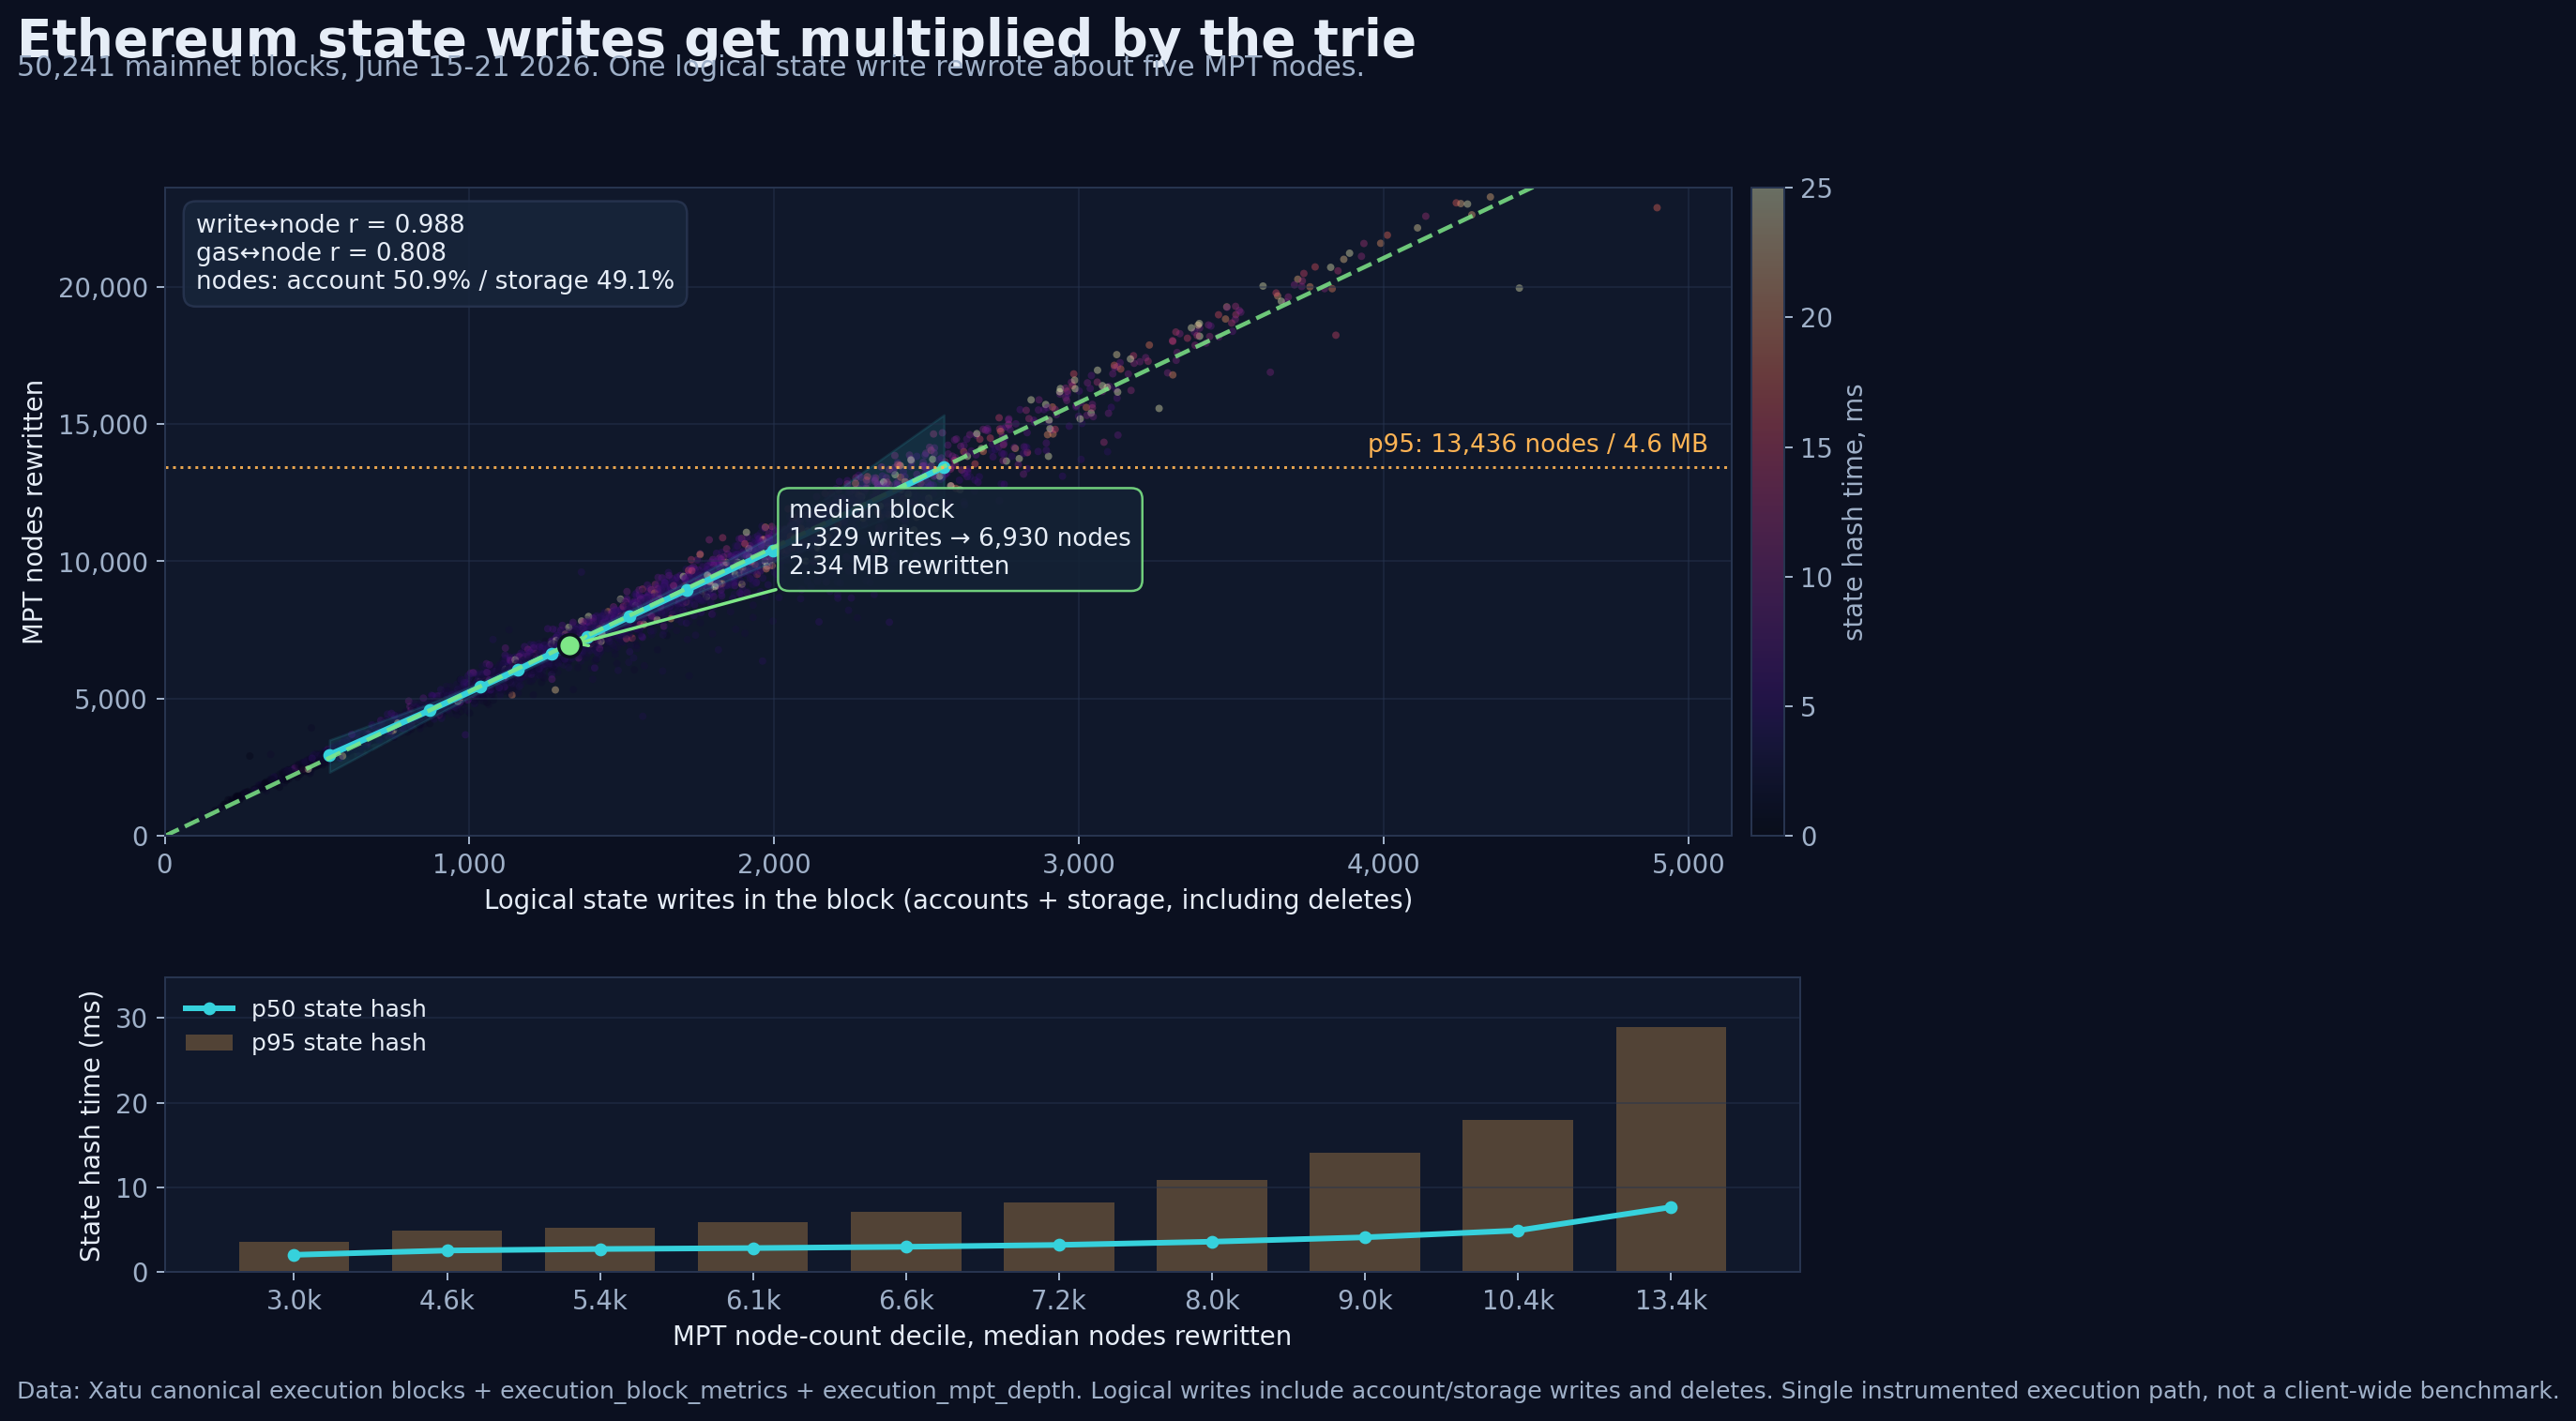
That sounds obvious if you have stared at Merkle Patricia tries long enough. It still hits differently when you count it block by block.
Across seven complete UTC days, the median Ethereum block made 1,329 logical state writes and rewrote 6,930 MPT nodes.
About 5.26 trie nodes per logical write. Every block. Quietly.
The trigger was the June 19 Glamsterdam test release, which pulled in EIP-8038 state-access gas work. Gas repricing arguments can get abstract fast, so I wanted the uglier lower-level number first:
when mainnet changes state today, how much trie machinery moves underneath it?
I used the seven complete UTC days from June 15 through June 21. The query joined three surfaces:
canonical_execution_blockfor the canonical block rangeexecution_block_metricsfor logical account/storage writes and timingexecution_mpt_depthfor account-trie and storage-trie nodes/bytes rewritten
Here is the query shape. The important part is that logical writes include deletes. I initially missed that, and the numbers got silly.
from ethpandaops import clickhouse

START = "2026-06-15 00:00:00"
END = "2026-06-22 00:00:00"

blocks = clickhouse.query("clickhouse-raw", f"""
SELECT
  block_number,
  toDate(block_date_time) AS day,
  ifNull(gas_used, 0) AS gas_used
FROM canonical_execution_block
WHERE meta_network_name = 'mainnet'
  AND block_date_time >= toDateTime('{START}')
  AND block_date_time <  toDateTime('{END}')
ORDER BY block_number
""")

lo = int(blocks.block_number.min())
hi = int(blocks.block_number.max())

mpt = clickhouse.query("clickhouse-raw", f"""
SELECT
  block_number,
  argMax(total_account_written_nodes, updated_date_time) AS acct_nodes,
  argMax(total_storage_written_nodes, updated_date_time) AS stor_nodes,
  argMax(total_account_written_bytes, updated_date_time) AS acct_bytes,
  argMax(total_storage_written_bytes, updated_date_time) AS stor_bytes
FROM execution_mpt_depth
WHERE meta_network_name = 'mainnet'
  AND block_number BETWEEN {lo} AND {hi}
GROUP BY block_number
""")

metrics = clickhouse.query("clickhouse-raw", f"""
SELECT
  block_number,
  avg(state_hash_ms) AS state_hash_ms,
  avg(commit_ms) AS commit_ms,
  avg(total_ms) AS total_ms,
  avg(state_writes_accounts) AS acct_writes,
  avg(state_writes_storage_slots) AS stor_writes,
  avg(state_writes_accounts_deleted) AS acct_deleted,
  avg(state_writes_storage_slots_deleted) AS stor_deleted
FROM execution_block_metrics
WHERE meta_network_name = 'mainnet'
  AND block_number BETWEEN {lo} AND {hi}
GROUP BY block_number
""")

joined = blocks.merge(mpt, on="block_number").merge(metrics, on="block_number")
joined["mpt_nodes"] = joined.acct_nodes + joined.stor_nodes
joined["logical_writes"] = (
    joined.acct_writes
    + joined.stor_writes
    + joined.acct_deleted
    + joined.stor_deleted
)
joined["nodes_per_write"] = joined.mpt_nodes / joined.logical_writes
The result was more stable than I expected.
| metric, June 15-21 | value |
|---|---|
| Blocks matched | 50,241 |
| Median logical writes per block | 1,329 |
| Median MPT nodes rewritten | 6,930 |
| Median rewritten trie bytes | 2.34 MB |
| Median MPT nodes per logical write | 5.26x |
| p95 MPT nodes rewritten | 13,436 |
| p95 rewritten trie bytes | 4.60 MB |
| Account / storage node split | 50.9% / 49.1% |
The write count and node count almost sit on top of each other. Correlation was 0.988. Gas was still correlated with trie churn, but less tightly, at 0.808.
That is the part I care about. Gas is the user-facing meter. The trie work is closer to what the execution client actually has to mutate.
The node-count tail also shows up in timing. The lowest node-count decile rewrote about 2,957 MPT nodes and had a median state-hash time around 2.05 ms. The top decile rewrote about 13,437 nodes and had a median hash time around 7.67 ms, with p95 near 29 ms.
Not terrifying. Not free either.
One trap: deletes matter.
I found this the annoying way. Block 25348733 looked absurd if I only counted state_writes_accounts + state_writes_storage_slots: it seemed to rewrite 20,443 trie nodes from only 232 logical writes. That was wrong. The same metrics row had 4,661 storage slot deletes, and raw canonical_execution_storage_diffs showed 4,778 storage diffs across 48 transactions in the block.
So deletes are not a footnote. They are state writes. Leave them out and the amplification number turns into fake drama.
With deletes included, the story gets cleaner and more useful:
Ethereum's current state path has a pretty boring multiplier. A logical account/storage write turns into roughly five trie-node rewrites. The median block rewrites a couple megabytes of trie nodes. Busy blocks rewrite four to six.
This is not a client-wide benchmark. The timing and trie-depth rows come from one instrumented execution path, so I would not use the milliseconds to rank clients. But the shape is still useful: the hidden work under a state write is not mysterious, and it is not one-to-one.
When gas repricing discussions say "state access," this is the texture underneath.
A write fans out.