Correction: I mistook empty slots for late blocks

In February I described Ethereum's block timestamps as a tight but noisy clock: 12.05 seconds on average, with 0.38% of blocks supposedly arriving more than 14 seconds after the previous one. That was the wrong clock. Execution payload timestamps are protocol slot time, so consecutive canonical blocks in the fixed seven-day reconstruction are either 12 seconds apart or, when one slot has no canonical block, 24 seconds apart.
The embarrassing bit is that the old 0.38% was close to a real number. It just measured empty-slot cadence, not late block arrival.
The first impossible number
The old post opened with 52,104 blocks over seven days. Mainnet schedules one slot every 12 seconds, which permits exactly 50,400 slots in seven complete UTC days. A block count above that ceiling should have stopped the analysis before it reached prose.
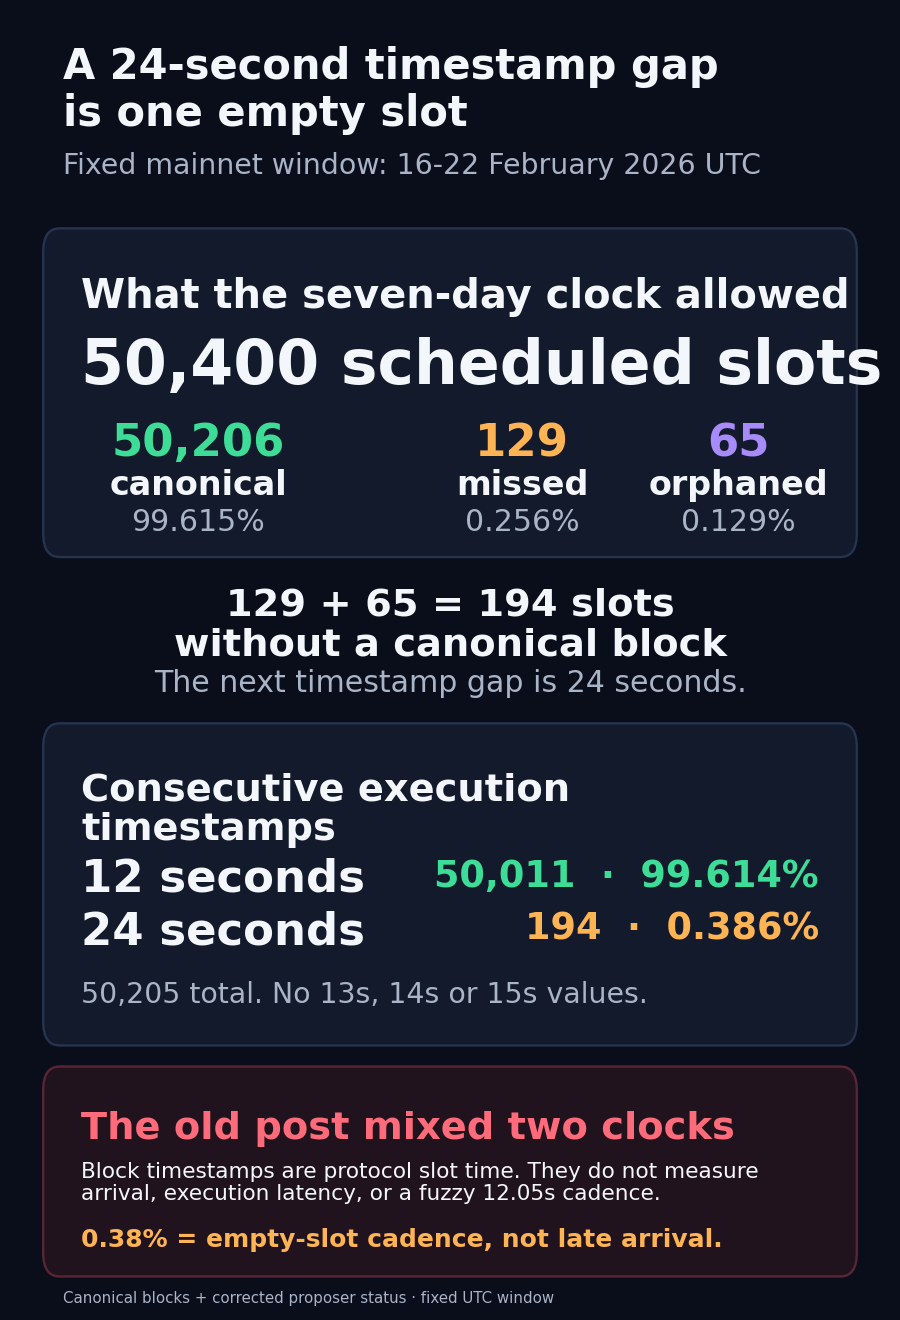
I cannot reproduce the moving snapshot used in February, so I froze the seven complete UTC days ending on the article date: February 16 through February 22, 2026. The corrected proposer-status table has exactly 50,400 semantic slot rows: 50,206 canonical, 129 missed and 65 orphaned. The raw canonical beacon table independently returns the same 50,206 exact (slot, block_root) pairs.
Here is the status cross-check:
SELECT
  count() AS scheduled_slots,
  countIf(status = 'canonical') AS canonical_slots,
  countIf(status = 'missed') AS missed_slots,
  countIf(status = 'orphaned') AS orphaned_slots
FROM mainnet.fct_block_proposer_by_validator FINAL
WHERE slot_start_date_time >= toDateTime('2026-02-16 00:00:00')
  AND slot_start_date_time <  toDateTime('2026-02-23 00:00:00');
That returns 50,400 / 50,206 / 129 / 65. There is no room for 52,104 blocks in this window.
These timestamps are slot labels
The consensus specification does not let a proposer write an arbitrary wall-clock arrival time into the execution payload. compute_time_at_slot is genesis time plus slot * SECONDS_PER_SLOT, and Bellatrix block processing requires the payload timestamp to equal that value. On mainnet, SECONDS_PER_SLOT is 12.
That gives the execution timestamp series a very specific shape. A canonical block after another canonical block is 12 seconds later. If the intervening slot is missed or its proposed block becomes orphaned, the next canonical payload timestamp is 24 seconds later. Arrival latency and execution time live in other telemetry fields; the payload timestamp cannot measure either one.
I checked every consecutive canonical execution block in the fixed window:
WITH ordered AS (
  SELECT
    block_number,
    block_date_time,
    lagInFrame(block_date_time) OVER (
      ORDER BY block_number
      ROWS BETWEEN 1 PRECEDING AND CURRENT ROW
    ) AS previous_time
  FROM default.canonical_execution_block FINAL
  WHERE meta_network_name = 'mainnet'
    AND block_date_time >= toDateTime('2026-02-16 00:00:00')
    AND block_date_time <  toDateTime('2026-02-23 00:00:00')
)
SELECT
  dateDiff('second', previous_time, block_date_time) AS interval_seconds,
  count() AS intervals
FROM ordered
WHERE previous_time > toDateTime64('1970-01-01 00:00:00', 3)
GROUP BY interval_seconds
ORDER BY interval_seconds;
The result has only two rows: 50,011 intervals at 12 seconds and 194 at 24 seconds. The mean is 12.04637 seconds and the median is 12, but those summary statistics are arithmetic over two protocol-defined values, not evidence of a naturally jittering 12.05-second production process. There are no 13-, 14- or 15-second intervals at all.
The 194 longer gaps are not a coincidence. The proposer-status path contains 129 missed + 65 orphaned = 194 slots without a canonical block. Raw canonical beacon slots produce the same gap count, and raw execution blocks reproduce the same 12/24-second distribution with a 50,206/50,206 exact block-key gate.
How 0.38% survived the correction
Of the 50,205 consecutive canonical-block intervals, 194 are 24 seconds. That is 0.386%. Measured against all 50,400 scheduled slots, the noncanonical share is 0.385%. Rounded to two decimals, both become the old post's 0.38%.
So the scale survived and the interpretation did not. The old article called this a tail of blocks delayed beyond 14 seconds. The corrected reading is much plainer: roughly 0.38% of scheduled slots in this reconstruction did not leave a canonical block, so the next canonical execution timestamp advanced by two slot steps.
The old table's other thresholds do not describe execution timestamps either. A claim that 38% exceeded 12 seconds cannot coexist with an exact series containing only 50,011 twelve-second intervals and 194 twenty-four-second intervals. The opening sentence also said 0.38% exceeded 12 seconds while its own table said 38%. That internal contradiction is now retracted rather than rationalized.
The client ranking was a different measurement
The post then jumped from block timestamps to engine_newPayload observer duration and presented the result as execution-client performance. That table was not evidence for the timestamp distribution, and it lacked a fixed observer cohort. Current raw history for the frozen window has two Reth observers, three Nethermind observers, seven go-ethereum observers, two Besu observers and two Erigon observers, with different reproduced averages from the February snapshot.
I am retracting the universal client-ranking language too. engine_newPayload is useful telemetry when node class, exact payload overlap, client version and observer cohort are controlled. A pooled row average is not an intrinsic client benchmark, and a low gas correlation does not identify the cause of one client's latency tail.
The corrected conclusion is deliberately boring. Ethereum's payload timestamp clock was exact. What varied was whether a slot left a canonical block, not the number written into the next block's timestamp.