Base's delayed safe head came with more L1 transactions, not fewer

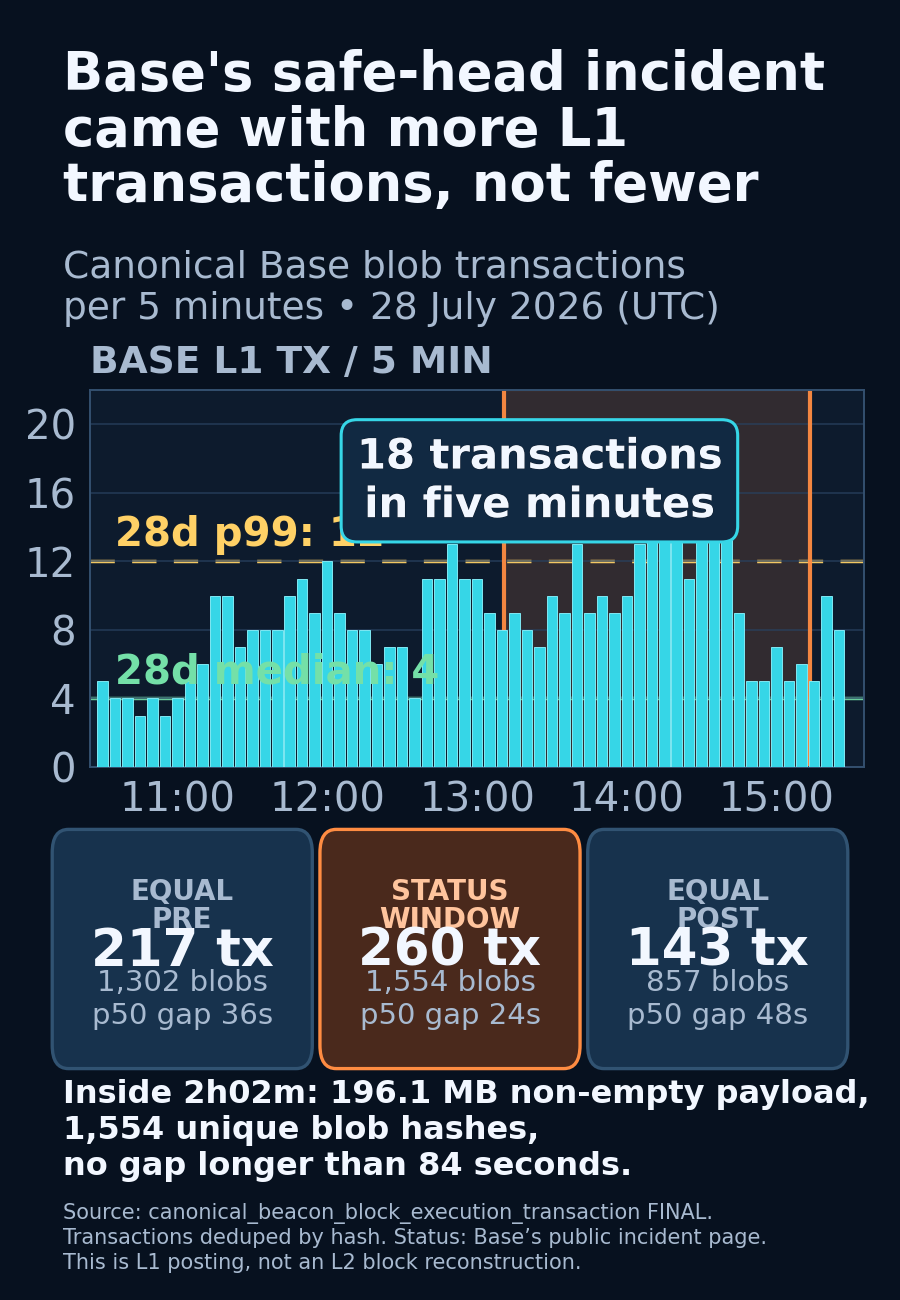
Base's July 28 incident said its safe head was delayed and batch submission was in partial outage. I expected a smaller version of the June chain-stall signature: the L1 batch sender going quiet. Instead, Base landed 260 canonical blob transactions carrying 1,554 blobs during the exact 2h02m status window, more than in either equal-length window beside it.
Base marked Batch submission as a partial outage at 13:10:59 UTC. Its update was unusually specific: new block production was progressing normally, but the safe head was delayed and only data batching to Ethereum L1 was affected. At 15:13:23, Base said the safe head was progressing normally and resolved the incident.
That wording made the L1 heartbeat worth checking again. The June 25 chain stall left a 78m12s hole in Base's canonical L1 blob transactions. July 28 did the opposite.
I used the same Base sender as the June analysis, 0x5050f69a9786f081509234f1a7f4684b5e5b76c9, but only as a historical identity label. The refined submitter mapping stopped at block 25,531,362, before this incident. Every count below comes from the fresh canonical transaction surface, which was current through August 11.
Here is the actual reduction behind the headline. It fetches one row per transaction hash over 28 complete days, then cuts the public incident and the equal-duration windows locally. nonempty_bytes is stored sidecar size minus stored empty sidecar capacity; it is not decoded L2 batch data.
from ethpandaops import clickhouse
import pandas as pd

sender = "0x5050f69a9786f081509234f1a7f4684b5e5b76c9"
incident_start = pd.Timestamp("2026-07-28 13:10:59.464", tz="UTC")
incident_end = pd.Timestamp("2026-07-28 15:13:23.957", tz="UTC")
duration = incident_end - incident_start

base = clickhouse.query("clickhouse-raw", f"""
SELECT
  hash,
  min(slot_start_date_time) AS ts,
  any(length(blob_hashes)) AS blobs,
  any(blob_sidecars_size) AS sidecar_bytes,
  any(blob_sidecars_empty_size) AS empty_bytes
FROM default.canonical_beacon_block_execution_transaction FINAL
WHERE meta_network_name = 'mainnet'
  AND slot_start_date_time >= toDateTime('2026-07-14 00:00:00')
  AND slot_start_date_time <  toDateTime('2026-08-11 00:00:00')
  AND type = 3
  AND lower(from) = '{sender}'
GROUP BY hash
ORDER BY ts, hash
""")

base["ts"] = pd.to_datetime(base["ts"], utc=True)
base["nonempty_bytes"] = base.sidecar_bytes - base.empty_bytes

windows = {
    "equal pre": (incident_start - duration, incident_start),
    "status window": (incident_start, incident_end),
    "equal post": (incident_end, incident_end + duration),
}

for name, (start, end) in windows.items():
    rows = base[(base.ts >= start) & (base.ts < end)]
    print(name, len(rows), rows.blobs.sum(), rows.nonempty_bytes.sum())
The equal pre-window had 217 transactions and 1,302 blobs. The status window had 260 transactions and 1,554 blobs, followed by 143 transactions and 857 blobs in the equal post-window. Base's median inter-transaction gap tightened from 36 seconds before the incident to 24 seconds during it, then relaxed to 48 seconds after it. The longest gap inside the incident was only 84 seconds.
The payload was not a pile of repeated blob IDs. All 1,554 blob-hash positions were unique, and the transactions carried 196.144 MB of non-empty sidecar bytes by the stored size fields. Almost every transaction carried six blobs; one carried five.
The burst was strange even before lining it up with the status page. Across the 28-day baseline, 36,278 Base transactions had a 72-second median gap, a 108-second p99, and a 168-second maximum. Complete five-minute bins had a median of four transactions and a p99 of 12. The incident burst peaked at 18 transactions in five minutes. Its 260-transaction total sat at the 99.6th percentile of 8,040 same-duration trailing windows sampled every five minutes.
It also started early. Five-minute counts were already running above the usual range by 11:15 UTC, nearly two hours before the public incident opened. The busiest part landed around 14:10-14:45, inside the status window, then the posting rate fell sharply before the incident was resolved.
I checked the entire six-hour comparison span through a second path. Canonical block bounds were 25,630,922 through 25,632,748. Separately fetched canonical_execution_transaction rows and deduped canonical_execution_block timestamps returned 620 Base transaction hashes, with a 620/620 exact intersection against the beacon-payload table and no unmatched hashes. Both paths counted the same 260 transactions during the incident.
Ethereum's blob market was healthy during those two hours. The canonical transaction table counted 1,247 type-3 transactions from 78 senders carrying 4,058 blobs. Base supplied 260 of the transactions and 1,554 of the blobs. Independently, mainnet.fct_block_blob_count FINAL returned the same 4,058 canonical blobs across 526 blob-carrying blocks.
This is not a root-cause post. Canonical L1 inclusion proves that Base paid for and landed blob transactions; it does not prove that Base's L2 derivation path accepted that data or advanced the safe head. Panda cannot identify which downstream step lagged here, and I am not going to invent one. I can only make the narrower claim: a delayed rollup safe head can coincide with an L1 posting burst, not an L1 silence.