Base's outage left a 78-minute hole in its L1 blob heartbeat

Base had a public bad day on June 25. The status page said mainnet block production was unhealthy at 16:03 UTC, sequencing had resumed by 17:51, and the incident was resolved at 19:22. The Beryl maintenance window still went ahead from 18:00 to 20:00.
Panda does not have Base's internal L2 chain data in this deployment, so I did not try to reconstruct Base blocks. Ethereum L1 still sees the batcher, though. Base's blob submitter is labelled in Xatu's blob_submitter table as 0x5050f69a9786f081509234f1a7f4684b5e5b76c9, and during the checked window it sent type-3 transactions to the fixed target 0xff00000000000000000000000000000000008453.
That gives us a useful heartbeat. It is not exact blob payload bytes, and it is not L2 block production. It is the L1 side of Base posting blob-carrying transactions.
The heartbeat normally ticks fast. Across June 23 through June 26 UTC, the median gap between Base L1 type-3 transactions was 48 seconds and the p99 gap was 96 seconds. Then the outage hit. Base posted at 16:05:35, then did not post another L1 type-3 transaction until 17:23:47. That is 78 minutes and 12 seconds with no Base L1 blob transaction.
The annoying part was making sure the clock was real. A direct distributed join between raw transactions and raw block rows gave slightly lower counts, because raw block rows can duplicate and shard-local joins can bite you. For the published numbers I bounded the block range first, fetched the type-3 transactions and block timestamps separately, deduped transactions by transaction_hash, reduced blocks to one timestamp per block_number, and joined locally.
from ethpandaops import clickhouse

min_block, max_block = 25376589, 25410957

transactions = clickhouse.query("clickhouse-raw", f"""
SELECT
  transaction_hash,
  any(block_number) AS tx_block_number,
  any(transaction_index) AS transaction_index,
  lower(any(from_address)) AS from_address,
  lower(coalesce(any(to_address), '')) AS to_address
FROM canonical_execution_transaction
WHERE meta_network_name = 'mainnet'
  AND block_number BETWEEN {min_block} AND {max_block}
  AND transaction_type = 3
GROUP BY transaction_hash
""")

blocks = clickhouse.query("clickhouse-raw", f"""
SELECT
  block_number,
  min(block_date_time) AS block_ts
FROM canonical_execution_block
WHERE meta_network_name = 'mainnet'
  AND block_number BETWEEN {min_block} AND {max_block}
GROUP BY block_number
""")

# Join transactions to block_ts locally, then cut the incident windows in Python.
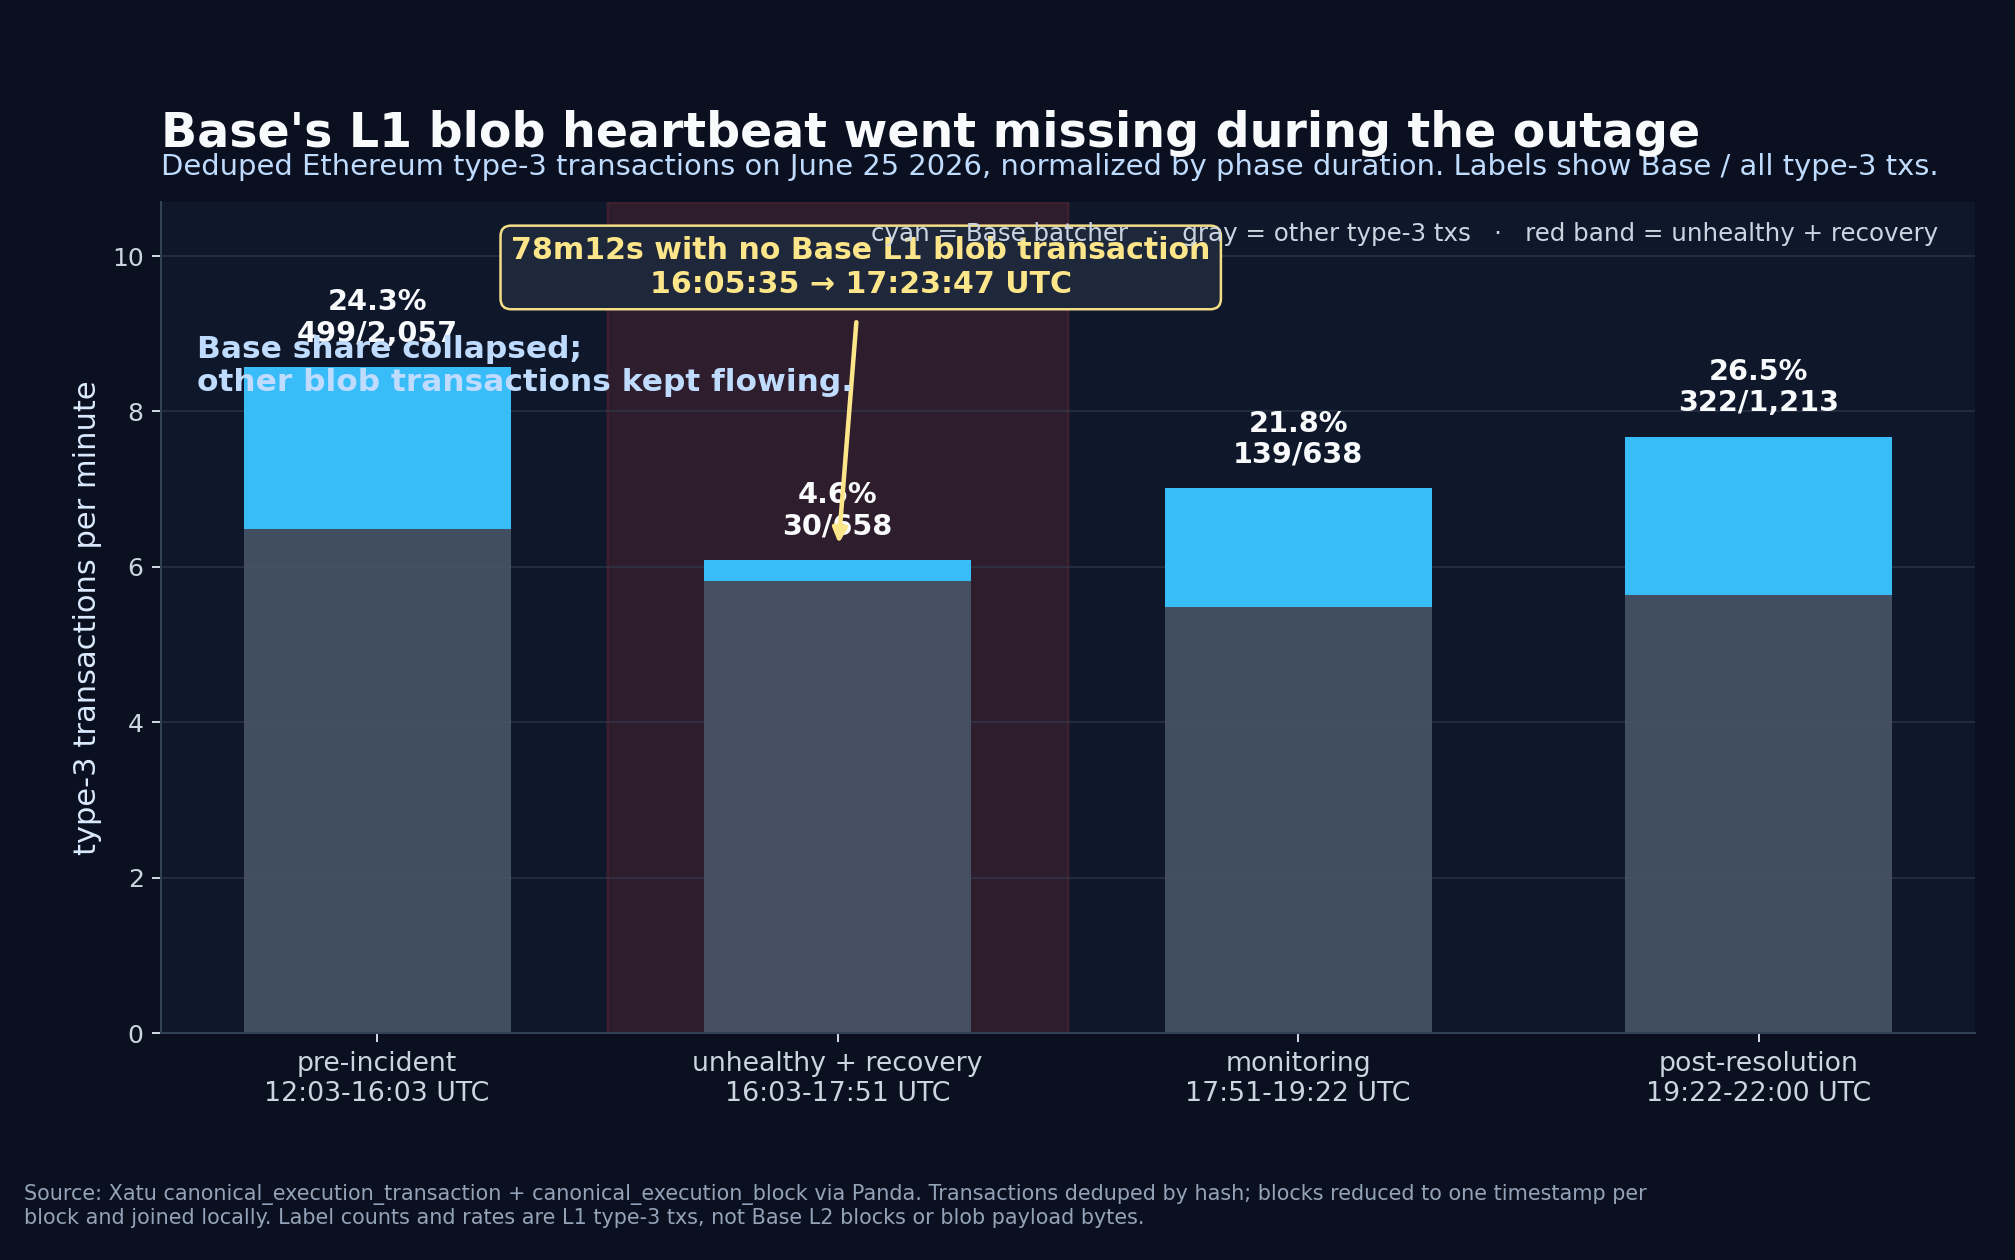
The sanity check is that Ethereum's blob transaction surface did not go quiet. During the 16:03-17:51 unhealthy/sequencing-recovery window, there were 658 type-3 transactions on Ethereum. Only 30 came from the Base submitter, a 4.6% share. In the four hours before the incident, Base was 499 of 2,057 type-3 transactions, or 24.3%, in the same measurement path.
A second, coarser path says the same thing. mainnet.fct_block_blob_count FINAL counted 1,568 blobs across 349 canonical blob blocks during the same 16:03-17:51 window. So this was not an L1 blob-market pause. Other blob users kept posting while Base's own L1 heartbeat had a hole in it.
SELECT
  countIf(status = 'canonical' AND blob_count > 0) AS canonical_blob_blocks,
  sumIf(blob_count, status = 'canonical') AS canonical_blobs
FROM mainnet.fct_block_blob_count FINAL
WHERE slot_start_date_time >= toDateTime('2026-06-25 16:03:00')
  AND slot_start_date_time <  toDateTime('2026-06-25 17:51:00')
The timing also does not line up perfectly with the public incident states. Base's status update at 17:51 said sequencing of new blocks had resumed and internal nodes were syncing correctly. The L1 heartbeat had already restarted at 17:23:47, roughly 27 minutes earlier, but it was choppy for a bit: a cluster around 17:20-17:30, then another small gap, then normal-looking flow into the monitoring period.
After the incident moved to monitoring, Base's share snapped back. From 17:51 to 19:22, the submitter sent 139 of 638 type-3 transactions, 21.8%. From 19:22 to 22:00, it sent 322 of 1,213, 26.5%. That looks like catch-up pressure on L1, though I would not turn that into an exact L2 backlog without Base-side block data.
The small but important caveat: this counts type-3 transactions, not blobs. A type-3 transaction can carry more than one blob. The chart is a heartbeat chart, not a payload chart, which is the cleaner claim anyway. The thing that disappeared for 78 minutes was not "all blobs" and not "Ethereum data availability." It was Base's own L1 posting rhythm.
A rollup outage can be visible on Ethereum without being an Ethereum outage.