Correction: I Counted Block Observers as Blocks

In February I published a chart with 7.4 million observations and called them slots. Ethereum produced 50,400 scheduled slots in that seven-day window, so that should have stopped me cold. It didn't.
The three arrival waves are real. The denominator on the original histogram was not.
What I got wrong
The old query grouped fct_block_first_seen_by_node into 200ms buckets and ran count():
SELECT
  intDiv(seen_slot_start_diff, 200) * 200 AS bucket_ms,
  count() AS slots
FROM mainnet.fct_block_first_seen_by_node
WHERE slot_start_date_time >= '2026-02-18 00:00:00'
  AND slot_start_date_time <  '2026-02-25 00:00:00'
  AND seen_slot_start_diff BETWEEN 100 AND 5000
GROUP BY bucket_ms
ORDER BY bucket_ms
That table is not one row per slot. Its transformation combines four event streams, then keeps the earliest observation at (slot_start_date_time, meta_client_name) grain. In plain English, one canonical block appears once for every monitoring client that saw it.
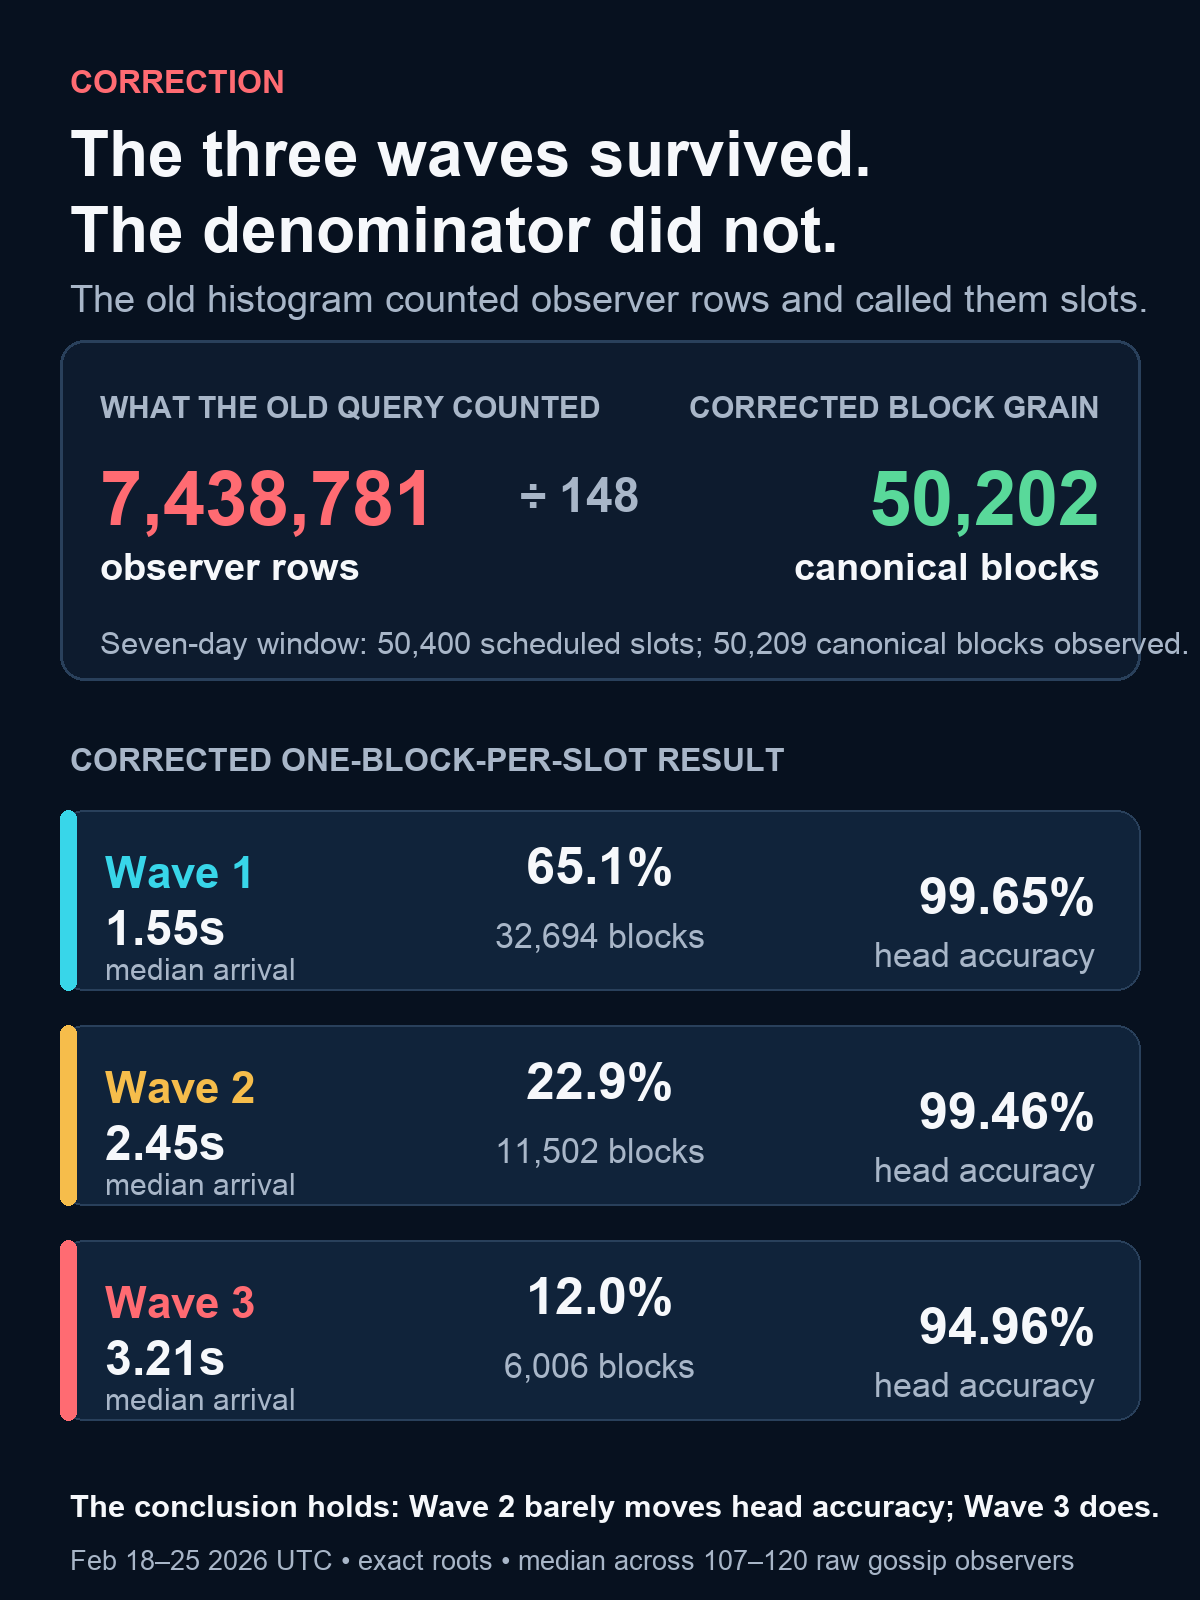
Running the old shape against the current FINAL view returns 7,438,781 observer rows. The corrected raw path has a median of 118 gossip observers per canonical block, with 107 to 120 in this window. The exact multiplier varies because the refined table includes more than the one raw gossip stream used for my independent check, but the mistake is simple: I counted witnesses to a block, not blocks.
The physical limit makes the error embarrassing rather than subtle. Seven days contain 50,400 scheduled 12-second slots. The raw canonical block table contains 50,209 canonical blocks in the window, and 50,202 of those have a block-level median between 100ms and 5,000ms. A headline of roughly 73,000 slots was impossible too; I should have checked it against the clock.
The corrected query
I rebuilt the timing series from the raw block-gossip table. First I resolved the exact canonical root for each slot. Then I reduced repeat event rows to one earliest observation per (slot, block root, observer), and only then took the median across observers for each canonical block.
WITH canonical AS (
  SELECT slot, block_root
  FROM default.canonical_beacon_block FINAL
  WHERE meta_network_name = 'mainnet'
    AND slot_start_date_time >= '2026-02-18 00:00:00'
    AND slot_start_date_time <  '2026-02-25 00:00:00'
), per_observer AS (
  SELECT
    g.slot,
    g.block AS block_root,
    g.meta_client_name,
    min(g.propagation_slot_start_diff) AS observer_first_ms
  FROM default.beacon_api_eth_v1_events_block_gossip AS g FINAL
  GLOBAL INNER JOIN canonical c
    ON g.slot = c.slot AND g.block = c.block_root
  WHERE g.meta_network_name = 'mainnet'
    AND g.slot_start_date_time >= '2026-02-18 00:00:00'
    AND g.slot_start_date_time <  '2026-02-25 00:00:00'
  GROUP BY g.slot, g.block, g.meta_client_name
), per_block AS (
  SELECT
    slot,
    block_root,
    quantileExact(0.5)(observer_first_ms) AS median_ms
  FROM per_observer
  GROUP BY slot, block_root
)
SELECT
  multiIf(median_ms < 2000, 'wave1',
          median_ms < 2800, 'wave2', 'wave3') AS wave,
  count() AS canonical_blocks,
  quantileExact(0.5)(median_ms) AS median_arrival_ms
FROM per_block
WHERE median_ms BETWEEN 100 AND 5000
GROUP BY wave
ORDER BY wave
This produces 32,694 Wave 1 blocks, 11,502 Wave 2 blocks and 6,006 Wave 3 blocks. They sum to 50,202. The shares are 65.1%, 22.9% and 12.0%, with median arrivals at 1.55s, 2.45s and 3.21s.
I also ran a second path through the refined timing table after joining it to canonical (slot, block_root) pairs. It returned 32,705, 11,496 and 6,002 blocks. Those differ from the raw gossip path by 11, 6 and 4 blocks because the refined model combines block, head, block-gossip and libp2p sources. The shape is the same, and neither path is remotely close to millions of blocks.
Does the conclusion survive?
Mostly, yes. Joining the corrected raw block classification to fct_attestation_correctness_canonical gives the following block-grain results:
- Wave 1: 32,694 blocks (65.1%), 1.55s median arrival, 99.652% head vote accuracy.
- Wave 2: 11,502 blocks (22.9%), 2.45s median arrival, 99.460% head vote accuracy.
- Wave 3: 6,006 blocks (12.0%), 3.21s median arrival, 94.963% head vote accuracy.
Wave 2 is 0.19 percentage points below Wave 1. Wave 3 is 4.69 points below it, about 24 times the Wave 2 penalty. The original post overstated the Wave 3 gap as 5.32 points and the ratio as 28 times, but the mechanism and the practical reading survive: blocks around 2.45s barely move aggregate head accuracy, while the 3.2s cohort falls off a cliff.
The MEV cross-check survives too. Among blocks with a positive canonical fct_block_mev value, median payments rise from 0.00935 ETH in Wave 1 to 0.00982 ETH in Wave 2 and 0.01056 ETH in Wave 3. Wave 3 still has the fat tail: its mean is 0.0570 ETH, versus 0.0213 ETH for Wave 2. I would not turn that into a causal price for waiting, but it is consistent with the original description of the cohorts.
What changes in the old post
The old histogram's y-axis, the claim of roughly 73,000 mainnet slots, and the sentence claiming 10,945 Wave 2 slots were wrong. The corrected Wave 2 count is 11,502 canonical blocks. Its share is still about 23%, and it appears every day in the window at 21.3% to 23.9% of observed canonical blocks.
I have added a dated correction banner to the original post and left its body intact. That is deliberate. Silently swapping in a clean chart would hide the exact failure mode, and this one is worth remembering: when a telemetry table says "by node," count() is usually counting the monitoring fleet.
The fastest sanity check was not a clever join. It was seven days times 7,200 slots per day.